Fig. 4.
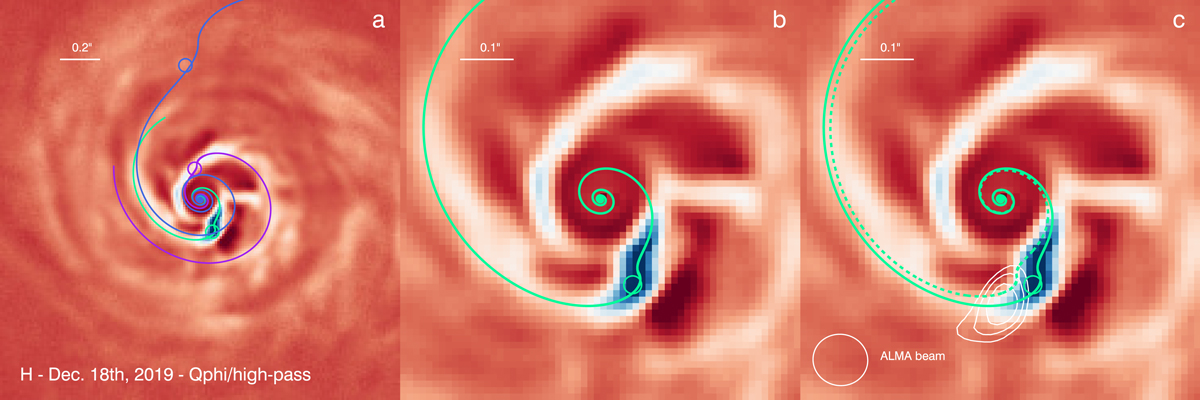
Same data as Fig. 3 with three different models of spirals matching S1 (green and blue lines) and S2 (purple line). The positions of the perturbers are indicated with a circle (panel a). Panel b: zoom in version of panel a, where only the best model reproducing the spiral twist in S1 is shown. Panel c: the contours of the CO map at the location of the candidate protoplanet are overlaid, together with the spiral model offset by 14.1° (dashed green line), corresponding to the 4 yr timelapse between ALMA and SPHERE observations.
Current usage metrics show cumulative count of Article Views (full-text article views including HTML views, PDF and ePub downloads, according to the available data) and Abstracts Views on Vision4Press platform.
Data correspond to usage on the plateform after 2015. The current usage metrics is available 48-96 hours after online publication and is updated daily on week days.
Initial download of the metrics may take a while.