Fig. 9.
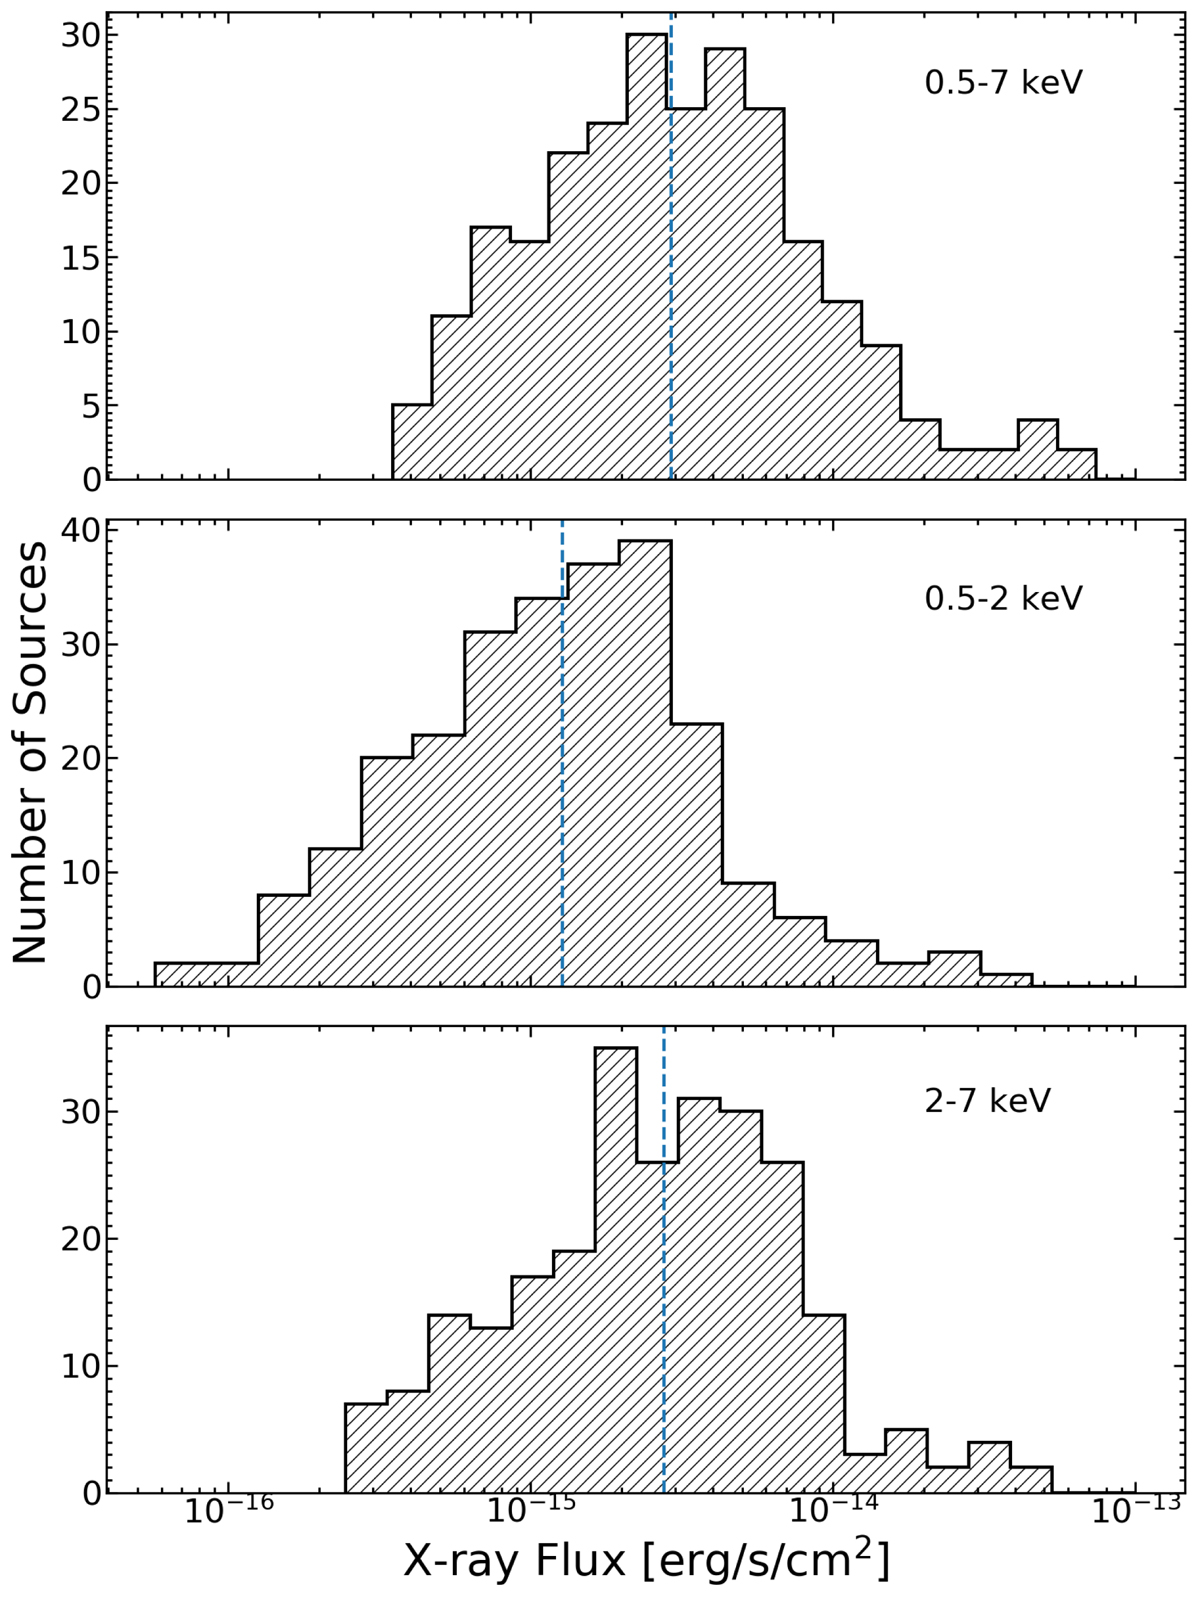
Aperture-corrected X-ray flux distributions for the sources detected in the full (top), soft (middle), and hard (bottom) bands. The cyan dotted vertical lines mark the medians of the distributions: 2.9, 1.3, 2.8 × 10⁻¹⁵ erg s−1 cm−2 for the full, soft, and hard bands, respectively. Sources with upper limits on the counts are not included in these plots.
Current usage metrics show cumulative count of Article Views (full-text article views including HTML views, PDF and ePub downloads, according to the available data) and Abstracts Views on Vision4Press platform.
Data correspond to usage on the plateform after 2015. The current usage metrics is available 48-96 hours after online publication and is updated daily on week days.
Initial download of the metrics may take a while.