Fig. 6.
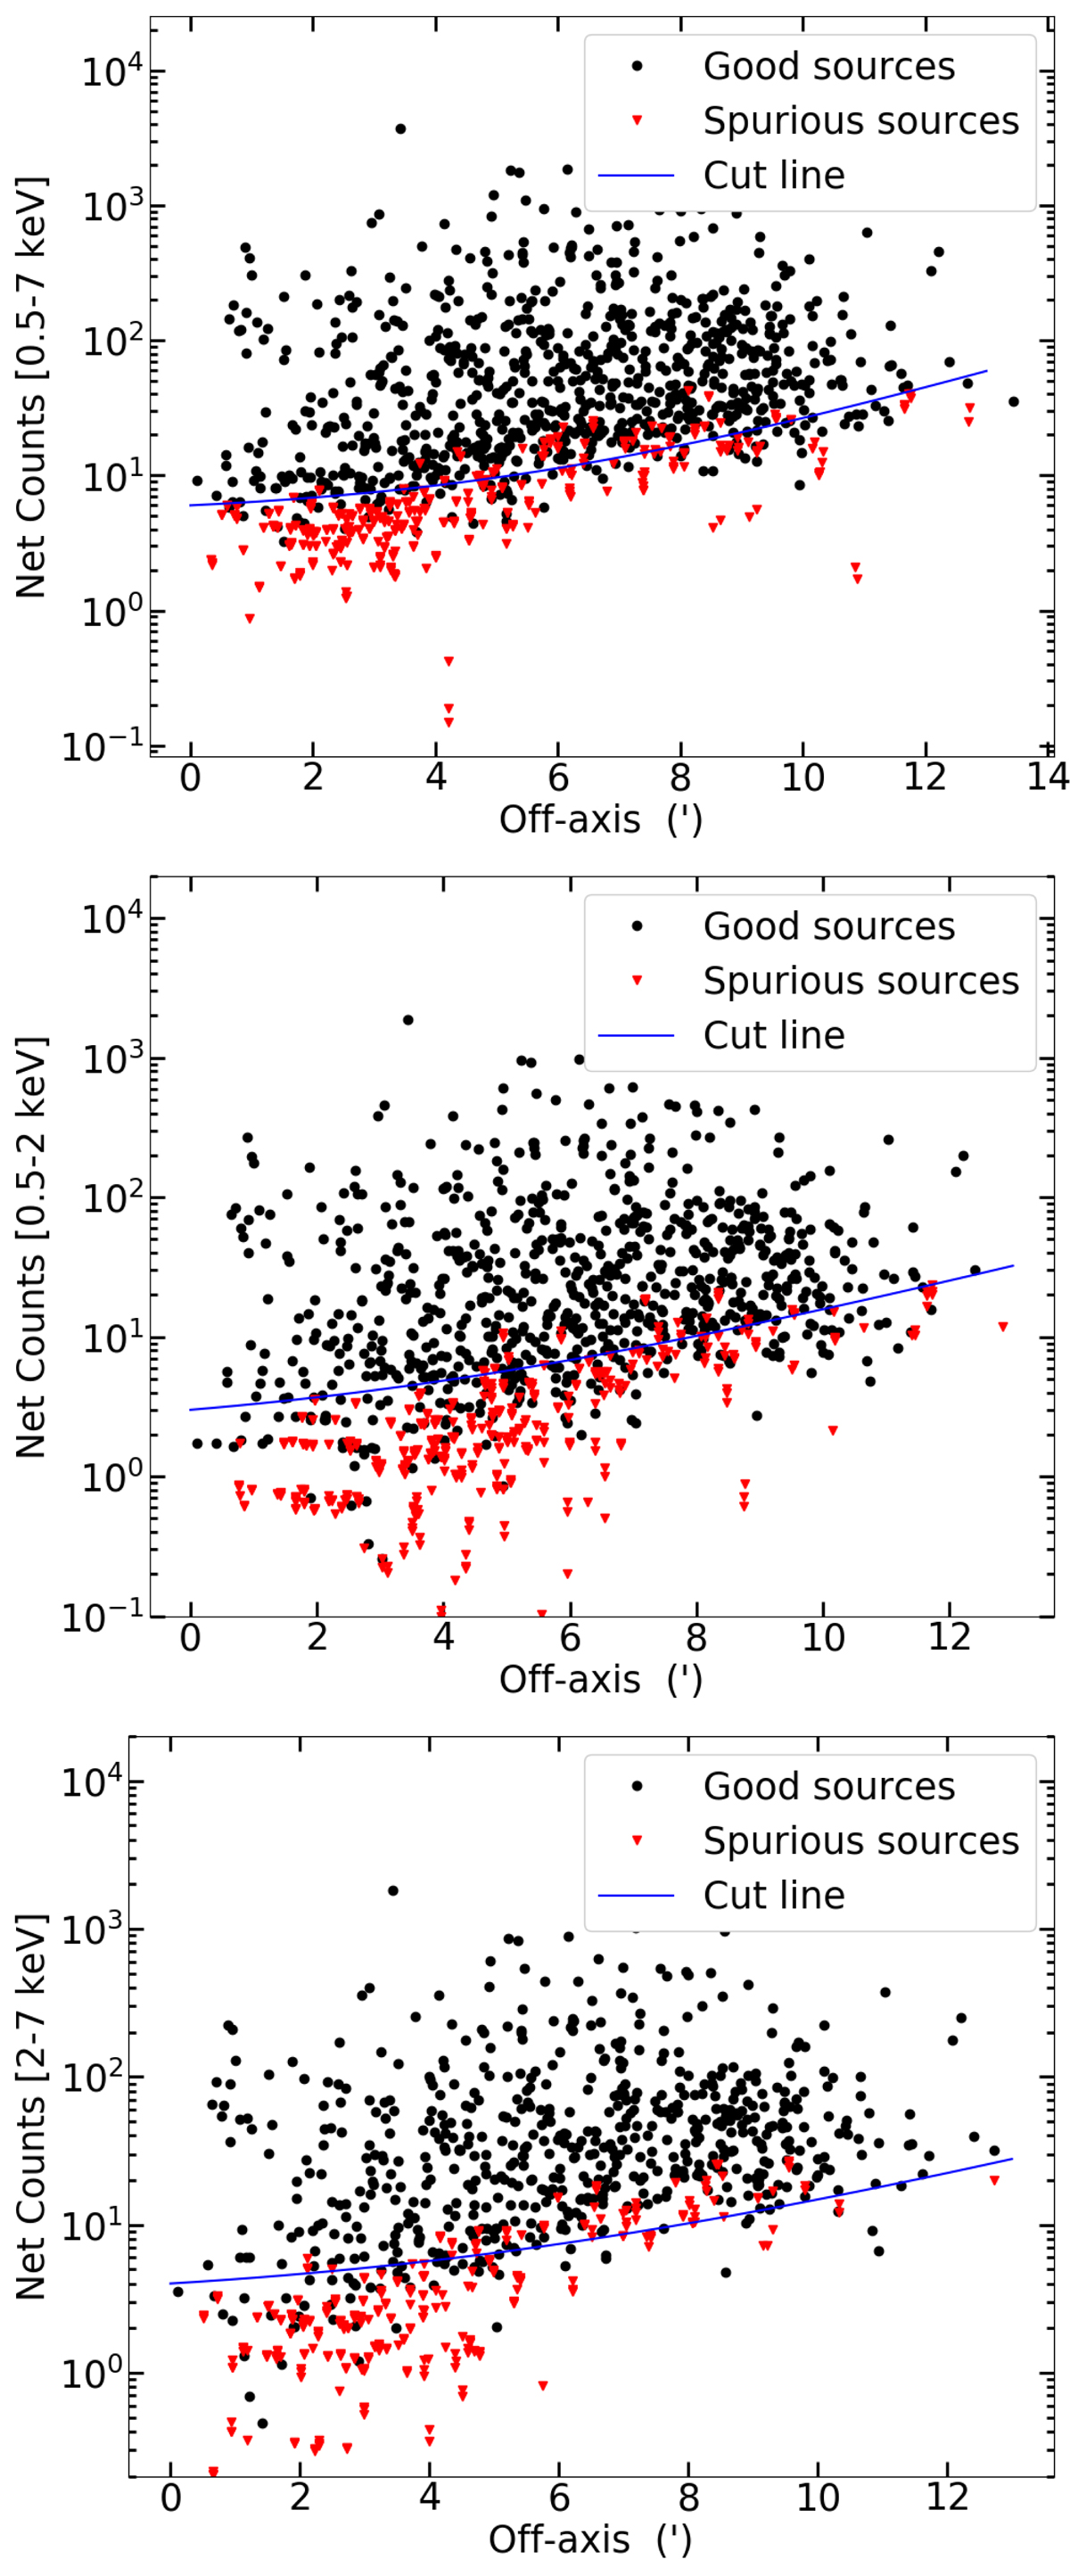
Net counts vs. off-axis angles for the sources detected in the three simulations in the full (top), soft (middle), and hard (bottom) bands. The black dots are the “good” input–output matches according to the likelihood-ratio method, while the red triangles are those considered as spurious. The blue line represents the source-count limit as a function of the off-axis angle adopted to compute the completeness and reliability.
Current usage metrics show cumulative count of Article Views (full-text article views including HTML views, PDF and ePub downloads, according to the available data) and Abstracts Views on Vision4Press platform.
Data correspond to usage on the plateform after 2015. The current usage metrics is available 48-96 hours after online publication and is updated daily on week days.
Initial download of the metrics may take a while.