Free Access
Fig. 3.
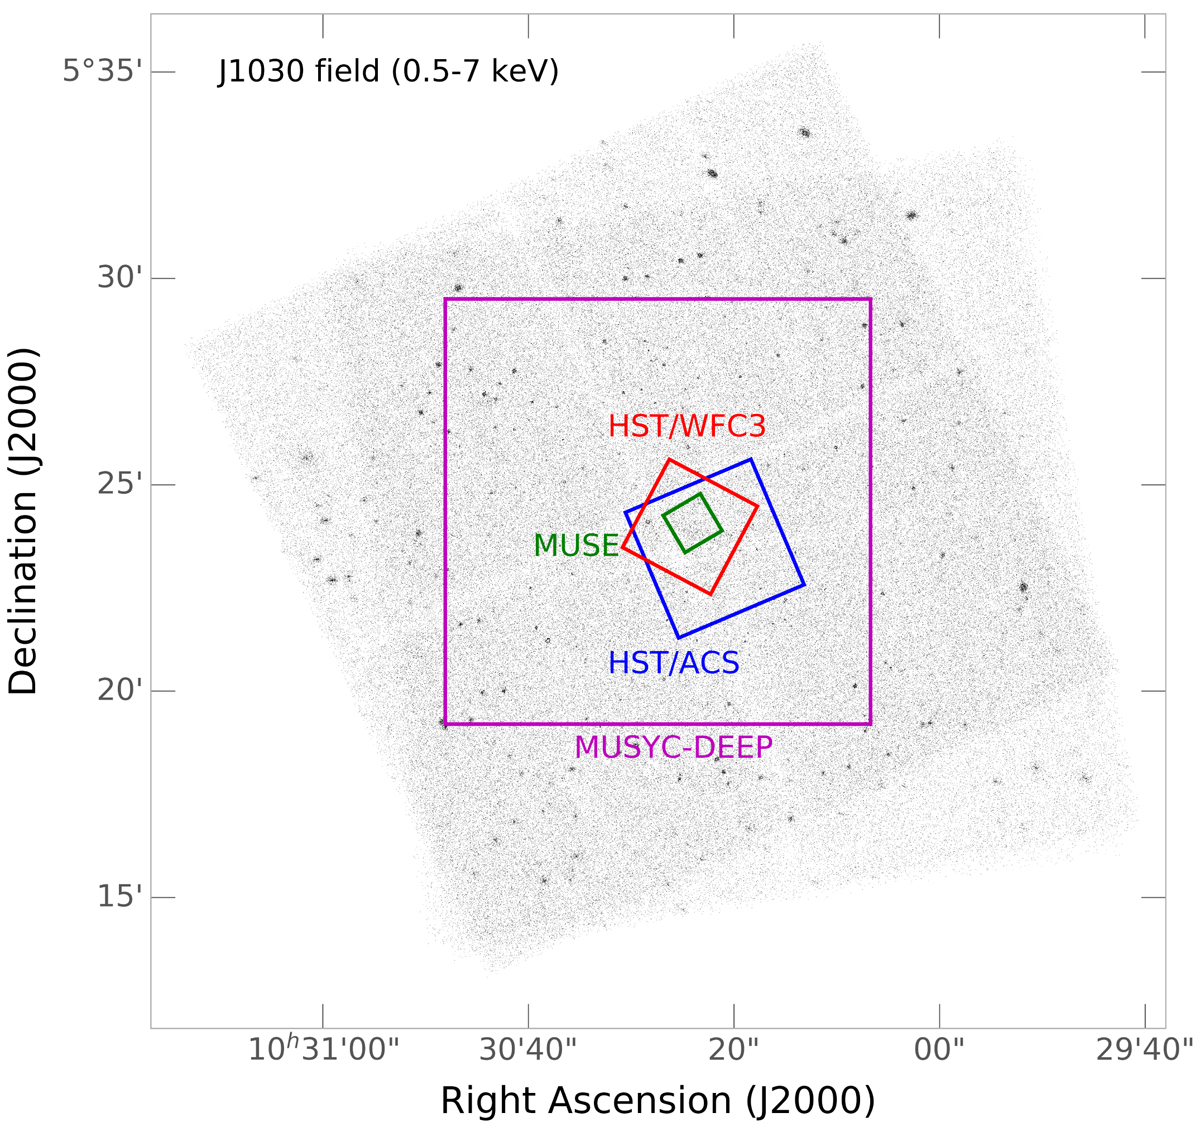
Full-band (0.5−7 keV) Chandra ACIS-I image of the SDSS J1030+0524 field in logarithmic gray scale. The multi-color regions show some of the central multi-wavelength coverage of the field: the MUSYC-DEEP in purple, HST/WFC3 in red, HST/ACS in blue, and VLT/MUSE in green.
Current usage metrics show cumulative count of Article Views (full-text article views including HTML views, PDF and ePub downloads, according to the available data) and Abstracts Views on Vision4Press platform.
Data correspond to usage on the plateform after 2015. The current usage metrics is available 48-96 hours after online publication and is updated daily on week days.
Initial download of the metrics may take a while.