Fig. 12.
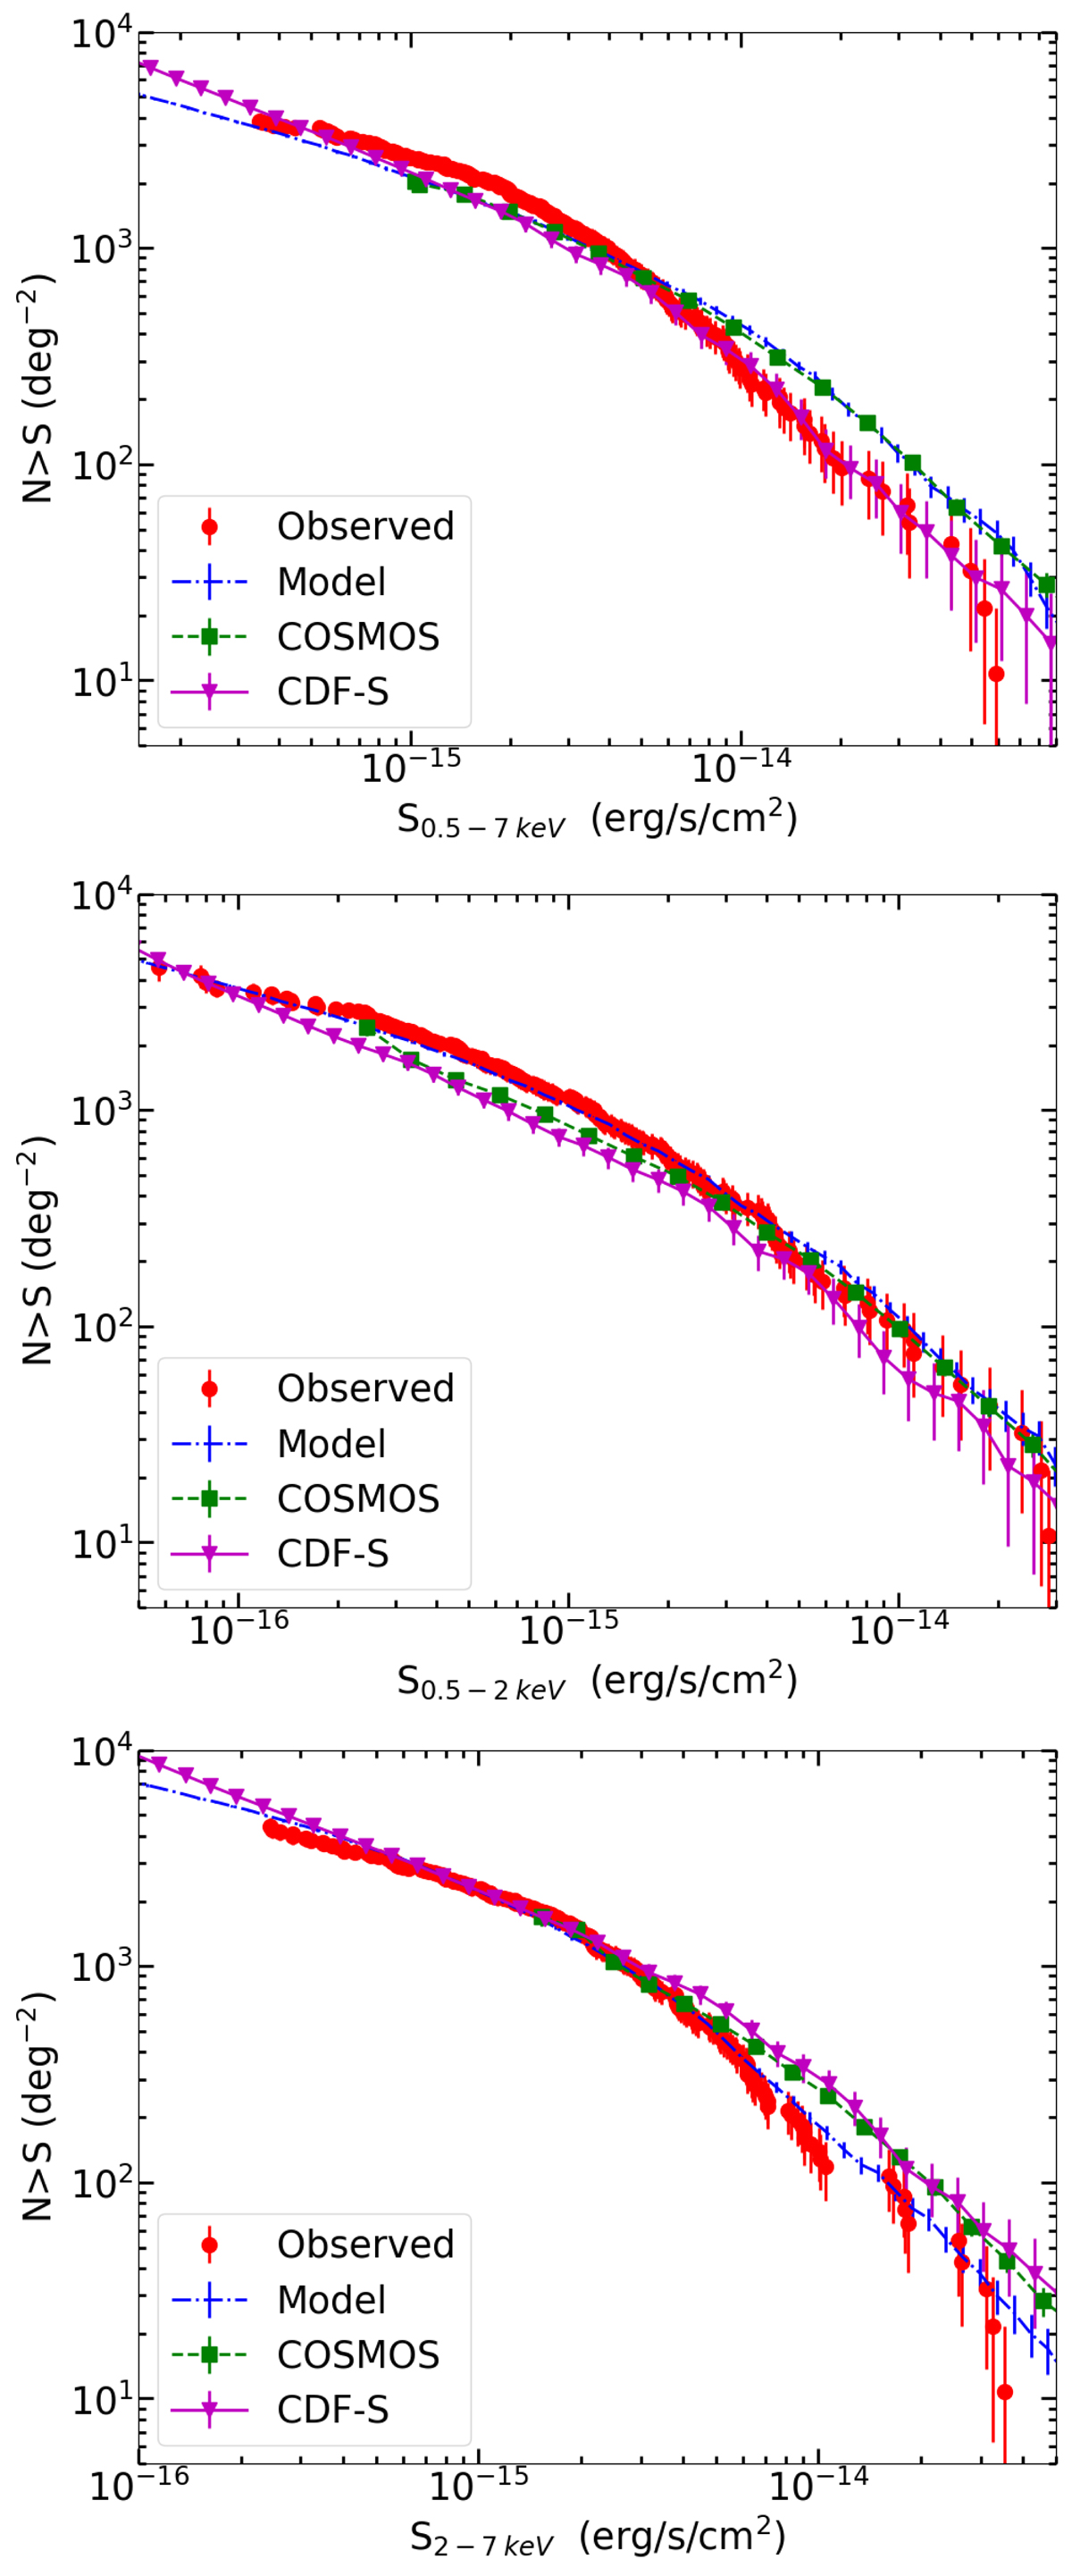
Cumulative number counts (number of sources brighter than a given flux) for the main source catalog (red dots) in the full (top), soft (middle), and hard (bottom) bands. The blue dot-dashed line represents the cumulative number of sources from our mock catalog. For comparison, we plot the log(N)–log(S) relations found in the 7 Ms Chandra Deep Field-South by Luo et al. (2017, magenta line), and in the COSMOS field by Civano et al. (2016, green dotted line).
Current usage metrics show cumulative count of Article Views (full-text article views including HTML views, PDF and ePub downloads, according to the available data) and Abstracts Views on Vision4Press platform.
Data correspond to usage on the plateform after 2015. The current usage metrics is available 48-96 hours after online publication and is updated daily on week days.
Initial download of the metrics may take a while.