Fig. 10.
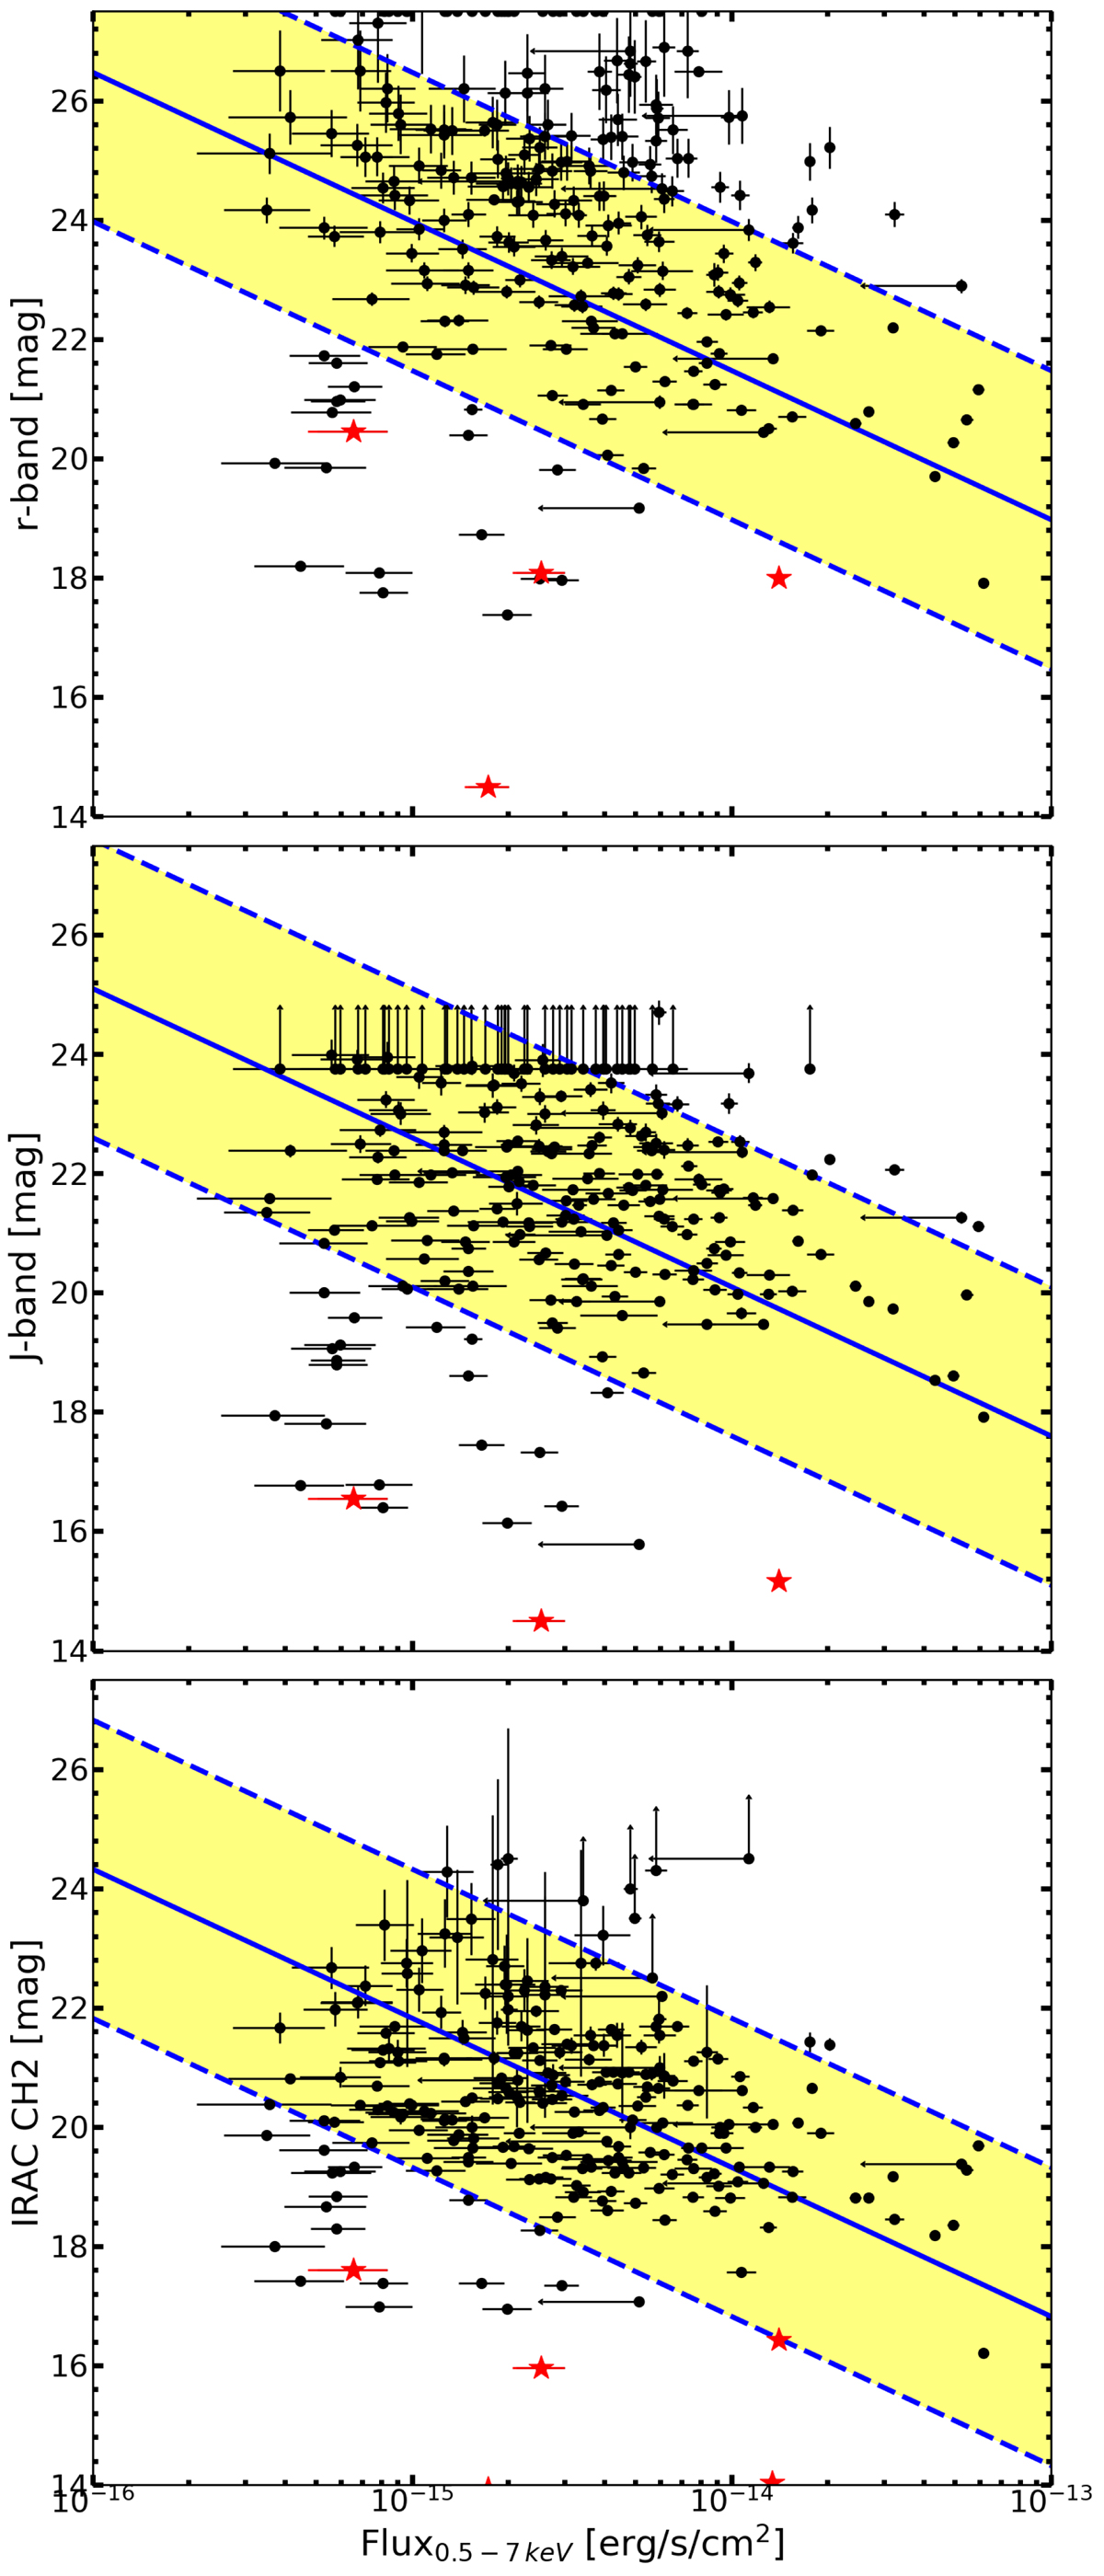
X-ray full-band flux vs. r-band (top panel), J-band (middle panel), and 4.5 μm-band (bottom panel) AB magnitudes. Black dots represent the main catalog sources, while red stars represent the known stars of our catalog. The blue diagonal dashed lines show constant X-ray to r-, J-, or 4.5 μm-band flux ratios log(fX/fopt) = − 1, + 1, while the blue diagonal solid line shows log(fX/fopt) = 0. The yellow shaded region highlights the area between the blue diagonal dashed lines that, for the optical bands, represents the “classic locus” of unobscured AGNs.
Current usage metrics show cumulative count of Article Views (full-text article views including HTML views, PDF and ePub downloads, according to the available data) and Abstracts Views on Vision4Press platform.
Data correspond to usage on the plateform after 2015. The current usage metrics is available 48-96 hours after online publication and is updated daily on week days.
Initial download of the metrics may take a while.