Fig. 1.
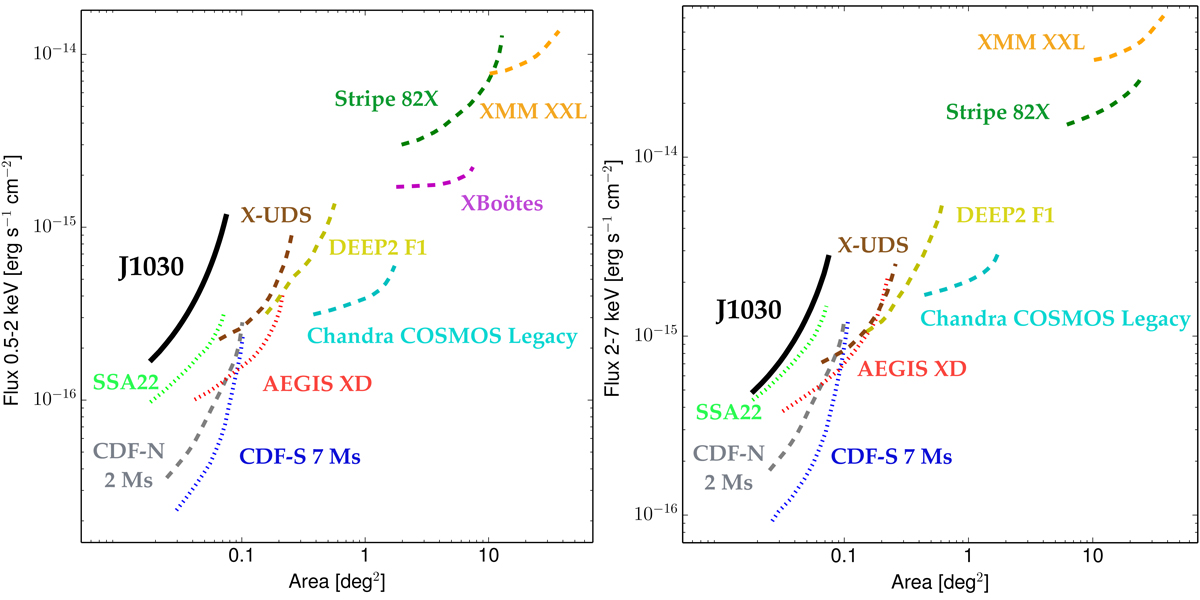
Area–flux curves for different deep and moderately deep Chandra surveys in the soft (left panel) and hard (right panel) bands. Each survey has been plotted using each sensitivity curve starting from the flux corresponding to 80% of the maximum area for that survey to the flux corresponding to 20% of the total area. The reported surveys are from: this work (black line), Luo et al. (2017) (blue dotted line), Xue et al. (2016) (gray dashed line), Nandra et al. (2015) (red dotted line), Lehmer et al. (2009) (light green dotted line), Kocevski et al. (2018) (brown dashed line), Civano et al. (2016) (cyan dashed line), LaMassa et al. (2016) (dark green dotted line), Menzel et al. (2016) (orange dashed line), Goulding et al. (2012) (yellow dashed line), and Murray et al. (2005) (magenta dashed line). Despite the shorter exposure (∼400 ks), the SSA22 survey is deeper in the soft band than J1030 due to the Chandra effective area degradation (equal to ∼25% at 1.4 keV) in this band.
Current usage metrics show cumulative count of Article Views (full-text article views including HTML views, PDF and ePub downloads, according to the available data) and Abstracts Views on Vision4Press platform.
Data correspond to usage on the plateform after 2015. The current usage metrics is available 48-96 hours after online publication and is updated daily on week days.
Initial download of the metrics may take a while.