Free Access
Fig. 3.
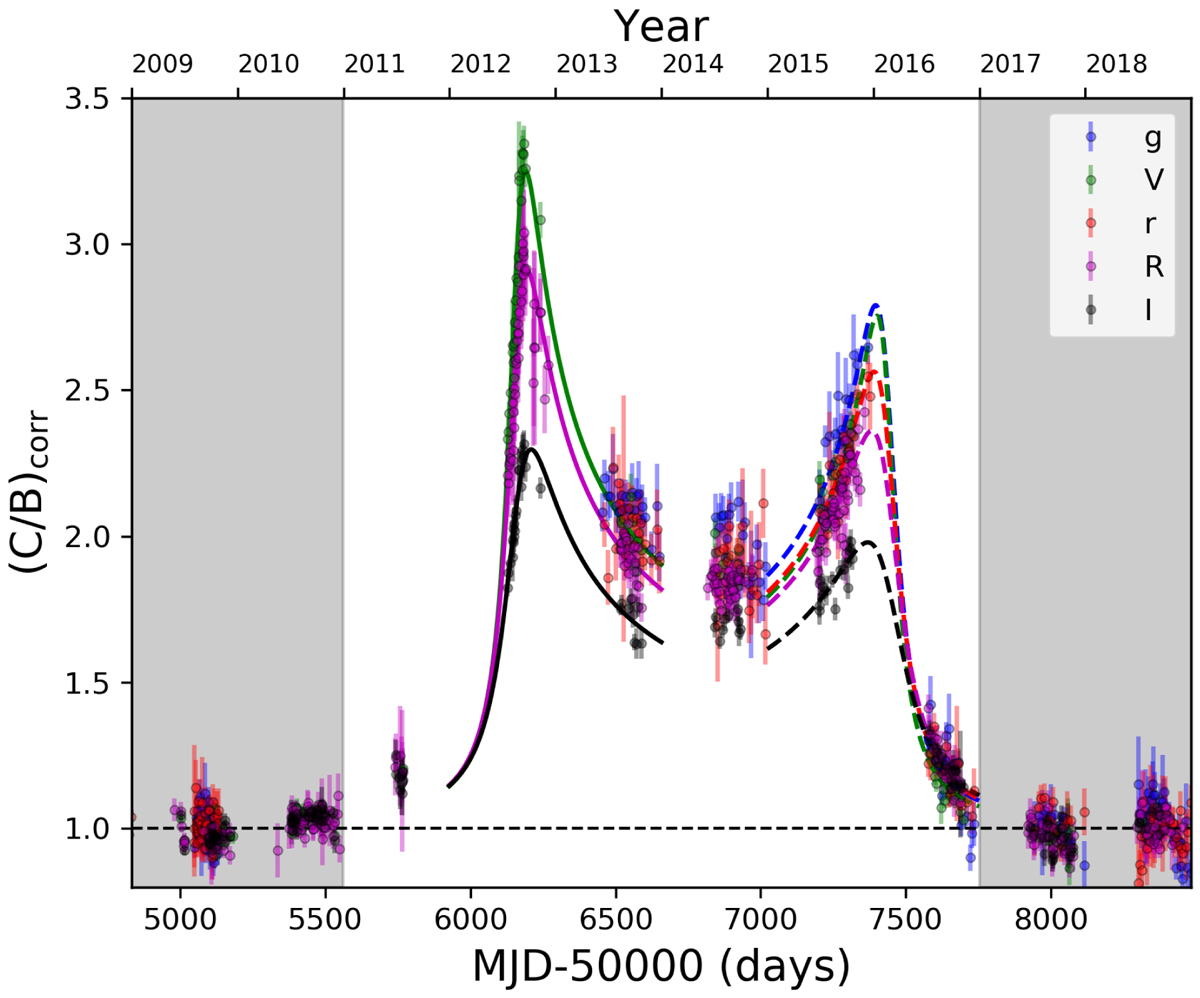
Corrected flux ratio (C/B)corr in the gVrRI bands. Each sharp monochromatic variation is fitted to the microlensing model μcaustic for a p = 3/2 power-law source (see Appendix B), yielding the solid and dashed lines (best-fit curves) associated with the caustic crossing events in 2012–2013 and 2015–2016, respectively.
Current usage metrics show cumulative count of Article Views (full-text article views including HTML views, PDF and ePub downloads, according to the available data) and Abstracts Views on Vision4Press platform.
Data correspond to usage on the plateform after 2015. The current usage metrics is available 48-96 hours after online publication and is updated daily on week days.
Initial download of the metrics may take a while.