Fig. 2.
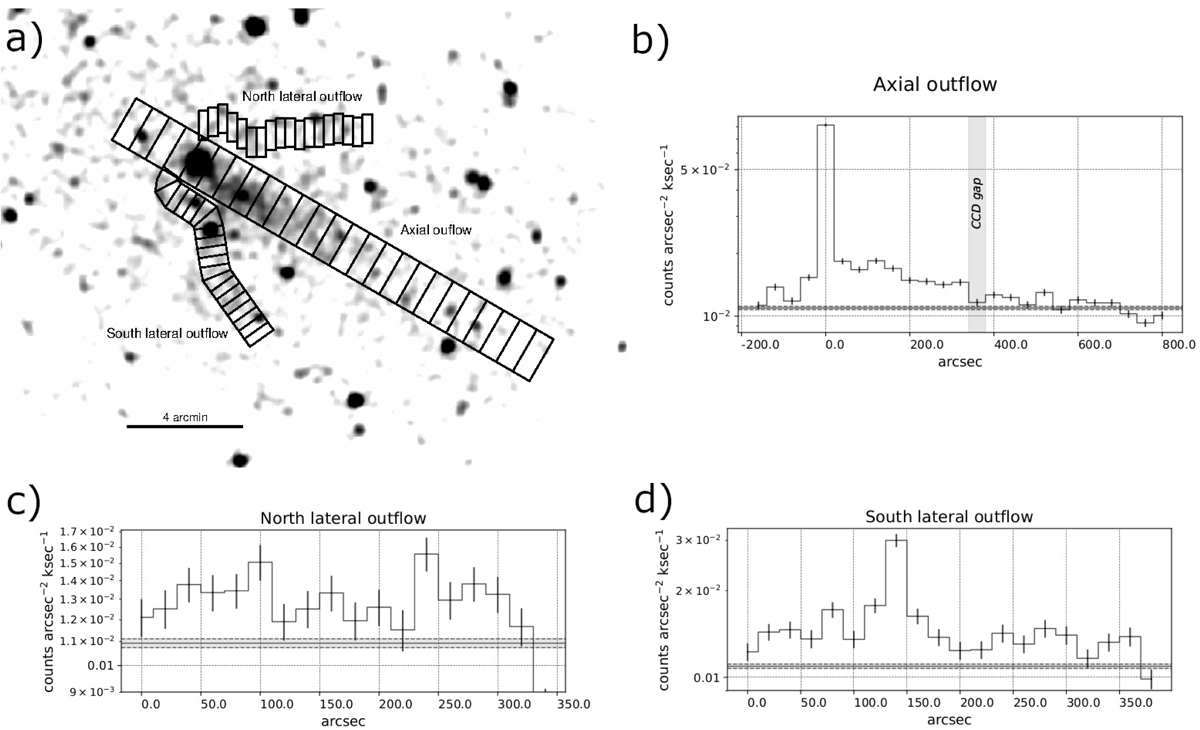
Panel a: sampling regions for computing the brightness profiles of various spatial components. Brightness profiles of axial outflow (panel b), north lateral outflow (panel c) and south lateral outflow (panel d) as estimated from the merged data. The black horizontal lines and the black dashed lines in panels b, c and d indicate the background flux and its 1-σ error deviations, respectively.
Current usage metrics show cumulative count of Article Views (full-text article views including HTML views, PDF and ePub downloads, according to the available data) and Abstracts Views on Vision4Press platform.
Data correspond to usage on the plateform after 2015. The current usage metrics is available 48-96 hours after online publication and is updated daily on week days.
Initial download of the metrics may take a while.