Fig. 8.
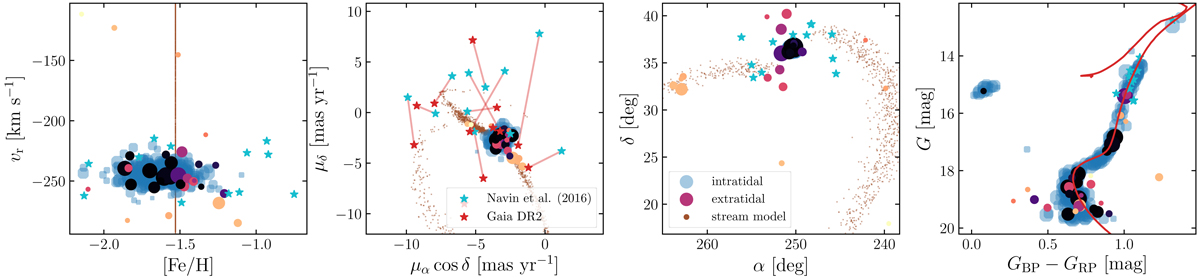
Comparison of the chemodynamical (left two panels) and spatial (third panel) distributions and the CMD (right) for M 13 between Navin et al. (2016; cyan stars) and the present study (same color and size scheme as in Fig. 7). In the proper motion diagram, the values from the original study are connected by red lines with their Gaia DR2 counterparts (red stars).
Current usage metrics show cumulative count of Article Views (full-text article views including HTML views, PDF and ePub downloads, according to the available data) and Abstracts Views on Vision4Press platform.
Data correspond to usage on the plateform after 2015. The current usage metrics is available 48-96 hours after online publication and is updated daily on week days.
Initial download of the metrics may take a while.