Fig. 7.
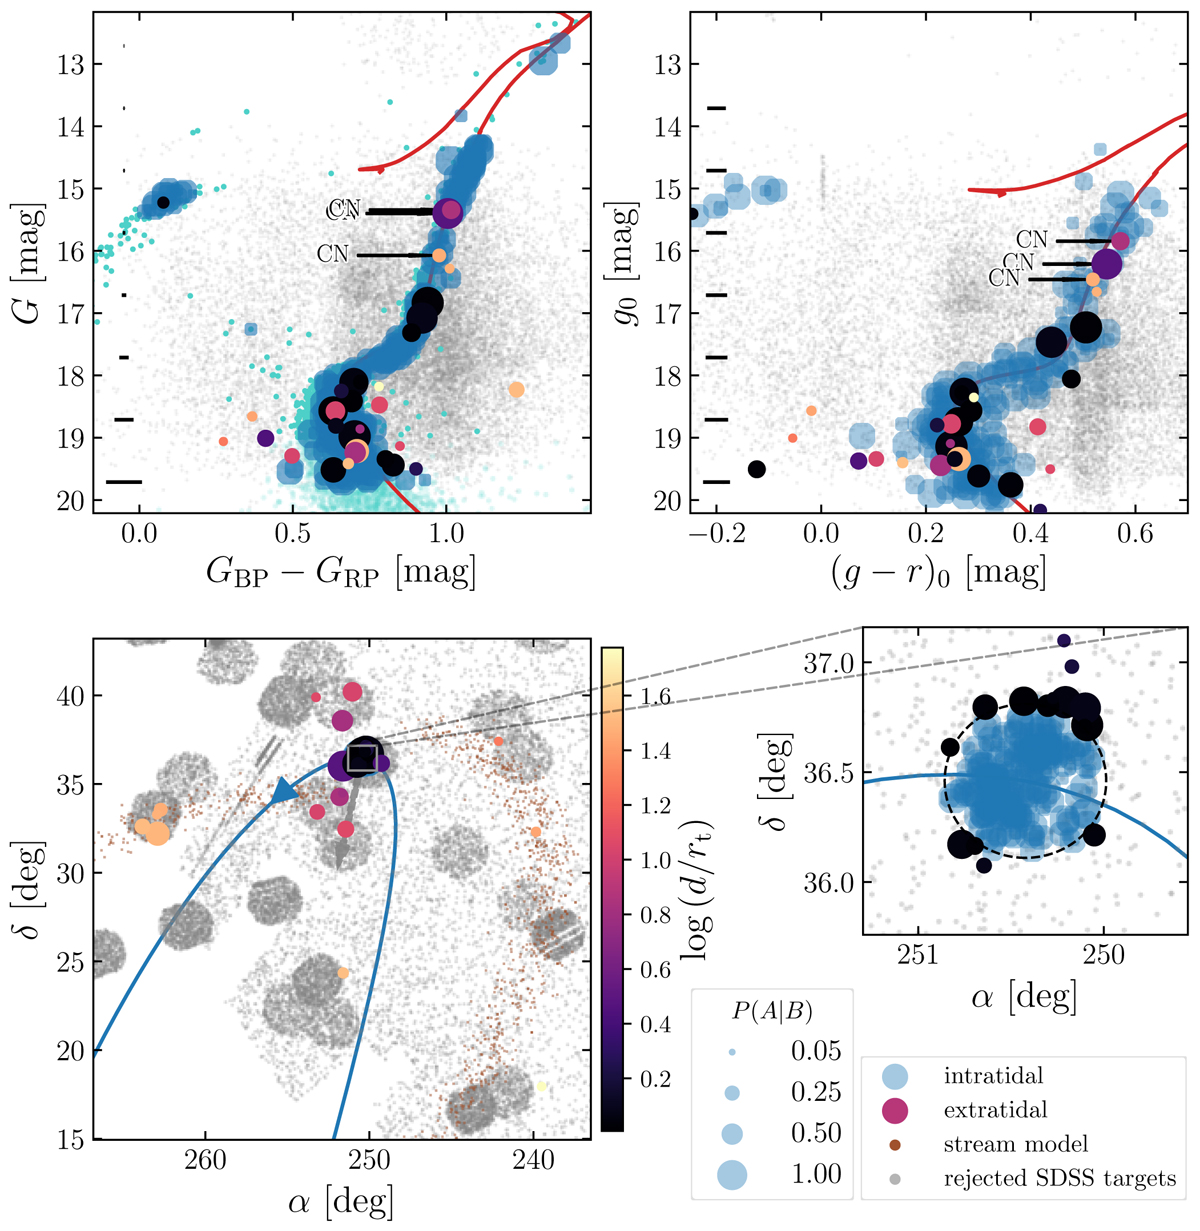
Parameter distributions of intra- (blue) and extratidal (black to light yellow) stars associated with M 13 on top of the field star population covered by the SDSS footprint (gray dots). The sizes of the colored circles are directly proportional to the membership probability P(A|B) as indicated in the legend, while the color of the extratidal candidates denotes the projected distance from the cluster core in units of rt (see color bar). Upper panels: CMDs from Gaia (left) and dereddened SDSS (right) bands. Cyan dots indicate proper motion and ϖ-selected Gaia sources without spectroscopic SDSS counterparts (see main text for details). Typical photometric errors are specified in each case by error bars on the left-hand side. For a subset of bright intratidal stars, reliable color information from SDSS is not available, which is why those targets were omitted in the right CMD. Red lines are 12 Gyr PARSEC isochrones (Marigo et al. 2017) matching the parameters from Table 1 with an applied manual shift in color for the Gaia CMD. The CN-strong giants classified in Paper I are labeled “CN” in both panels. Lower panels: distribution on the sky (left) and a zoomed-in view of the immediate cluster vicinity (right). The black-dashed ellipse indicates the tidal radius, rt, and the direction to the Galactic center is marked by a gray arrow. Properties for the integrated cluster orbit and the simulated stream are indicated by the blue curve and brown dots, respectively.
Current usage metrics show cumulative count of Article Views (full-text article views including HTML views, PDF and ePub downloads, according to the available data) and Abstracts Views on Vision4Press platform.
Data correspond to usage on the plateform after 2015. The current usage metrics is available 48-96 hours after online publication and is updated daily on week days.
Initial download of the metrics may take a while.