Fig. 6.
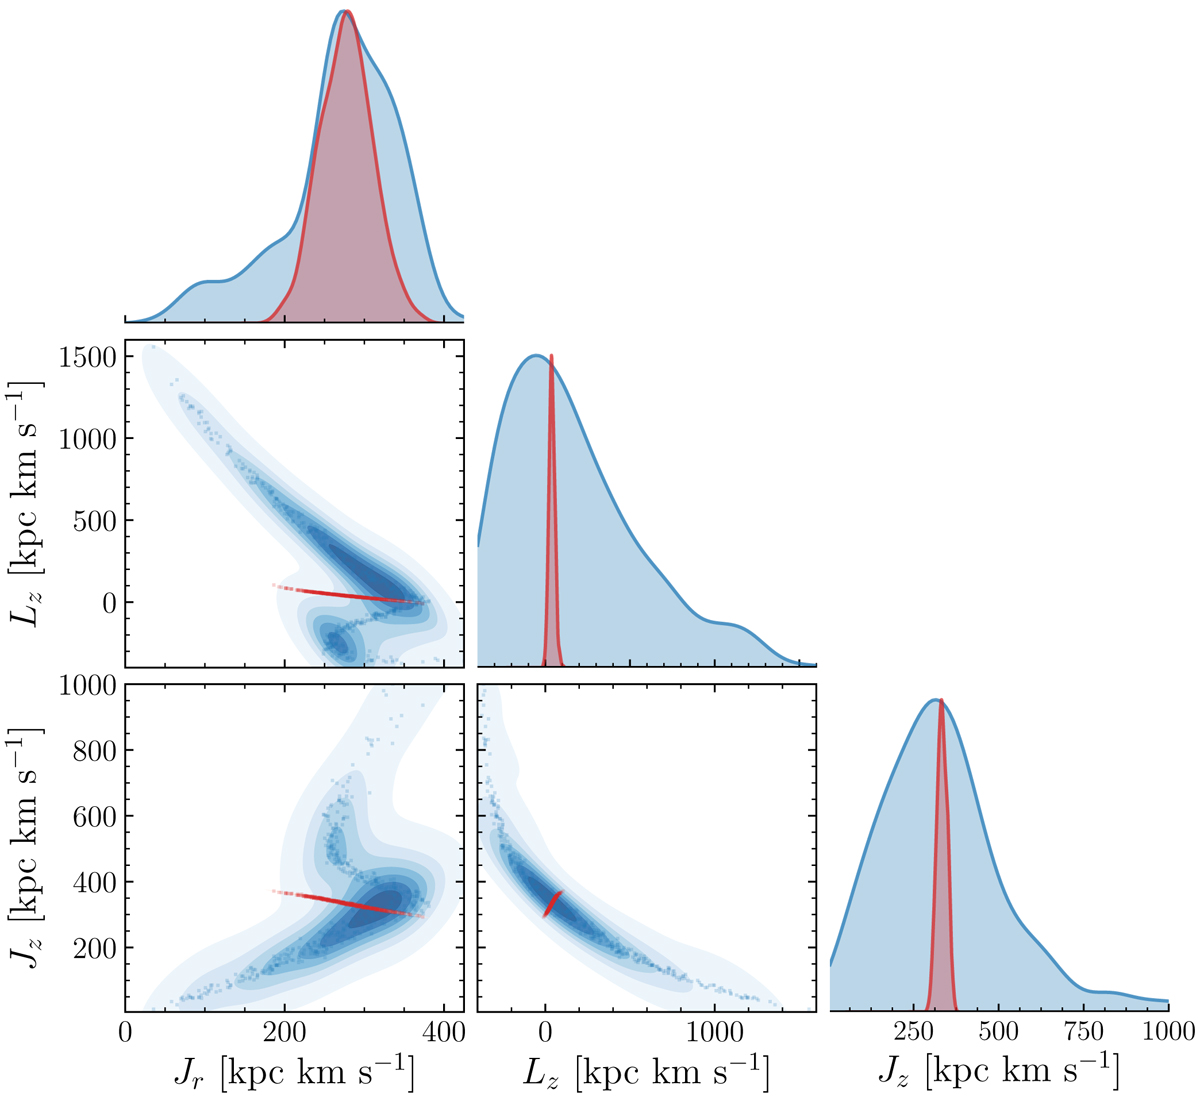
Distribution of Monte Carlo samples for the integrals of motion for M 70 (red) and the star Gaia DR2 3833963854548409344 (blue). The marginalized two-dimensional and one-dimensional kernel density estimates are indicated as contours in the frames and histograms at the top, respectively. For illustrative purposes, the histograms were normalized by their maxima.
Current usage metrics show cumulative count of Article Views (full-text article views including HTML views, PDF and ePub downloads, according to the available data) and Abstracts Views on Vision4Press platform.
Data correspond to usage on the plateform after 2015. The current usage metrics is available 48-96 hours after online publication and is updated daily on week days.
Initial download of the metrics may take a while.