Fig. 5.
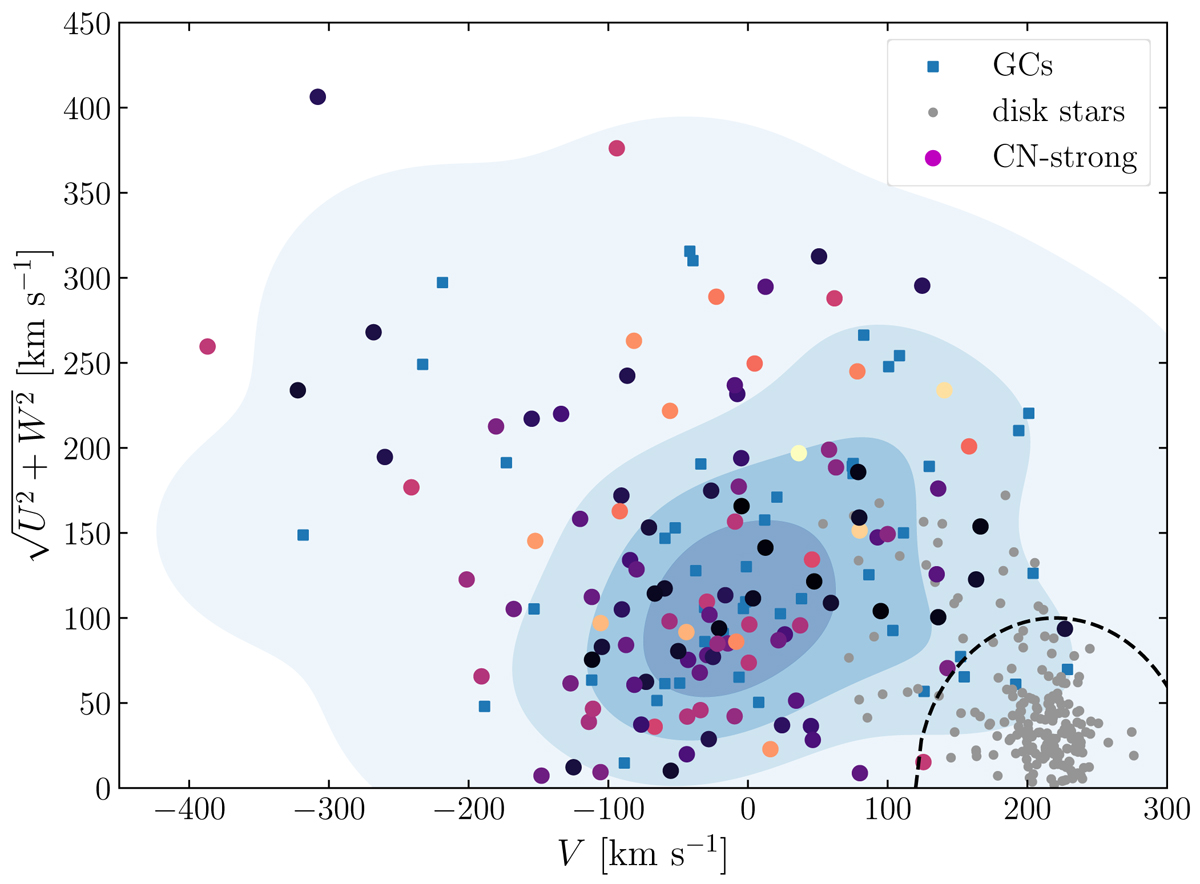
Toomre diagram for our CN-strong giants (colored circles) and the Galactic GC population (blue squares). The latter is only shown in the regime −1.8 < [Fe/H] < −1.3 dex, representing the coverage of the analyzed stars. The color coding of the CN-strong stars is the same as in Fig. 4. For better comparability, an additional Gaussian kernel density estimate of the GC sample is provided where increasing color darkness resembles increasing density. To show the clear contrast to the Galactic disk population, we also indicate all targets from our Gaia – SDSS crossmatch that obey −5° < b < 5° and have a spectrophotometric distance as determined by SDSS of less than 1 kpc (gray dots). Moreover, the dashed line encircles the region of absolute velocities of less than 100 km s−1 with respect to the local standard of rest.
Current usage metrics show cumulative count of Article Views (full-text article views including HTML views, PDF and ePub downloads, according to the available data) and Abstracts Views on Vision4Press platform.
Data correspond to usage on the plateform after 2015. The current usage metrics is available 48-96 hours after online publication and is updated daily on week days.
Initial download of the metrics may take a while.