Fig. 4.
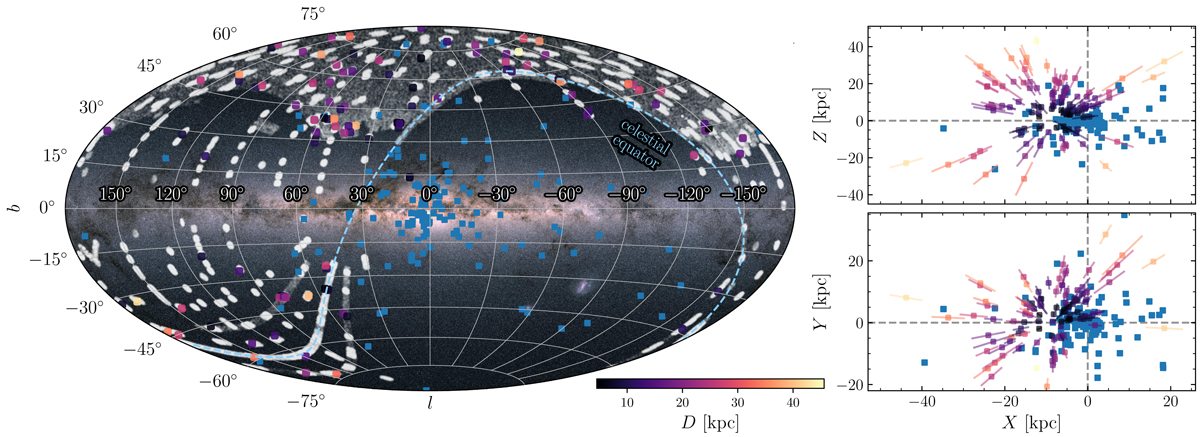
Spatial distribution of GCs (blue squares) and CN-strong halo giants (colored according to their distance) in Galactic coordinates (left) and the Cartesian Galactocentric frame (right). The dashed line in the left panel denotes the celestial equator. The SDSS footprint area is depicted in white while the Gaia all-sky map is illustrated in the background for orientation. Image credit. Gaia Data Processing and Analysis Consortium (DPAC); A. Moitinho/A. F. Silva/M. Barros/C. Barata, University of Lisbon, Portugal; H. Savietto, Fork Research, Portugal.
Current usage metrics show cumulative count of Article Views (full-text article views including HTML views, PDF and ePub downloads, according to the available data) and Abstracts Views on Vision4Press platform.
Data correspond to usage on the plateform after 2015. The current usage metrics is available 48-96 hours after online publication and is updated daily on week days.
Initial download of the metrics may take a while.