Fig. 3.
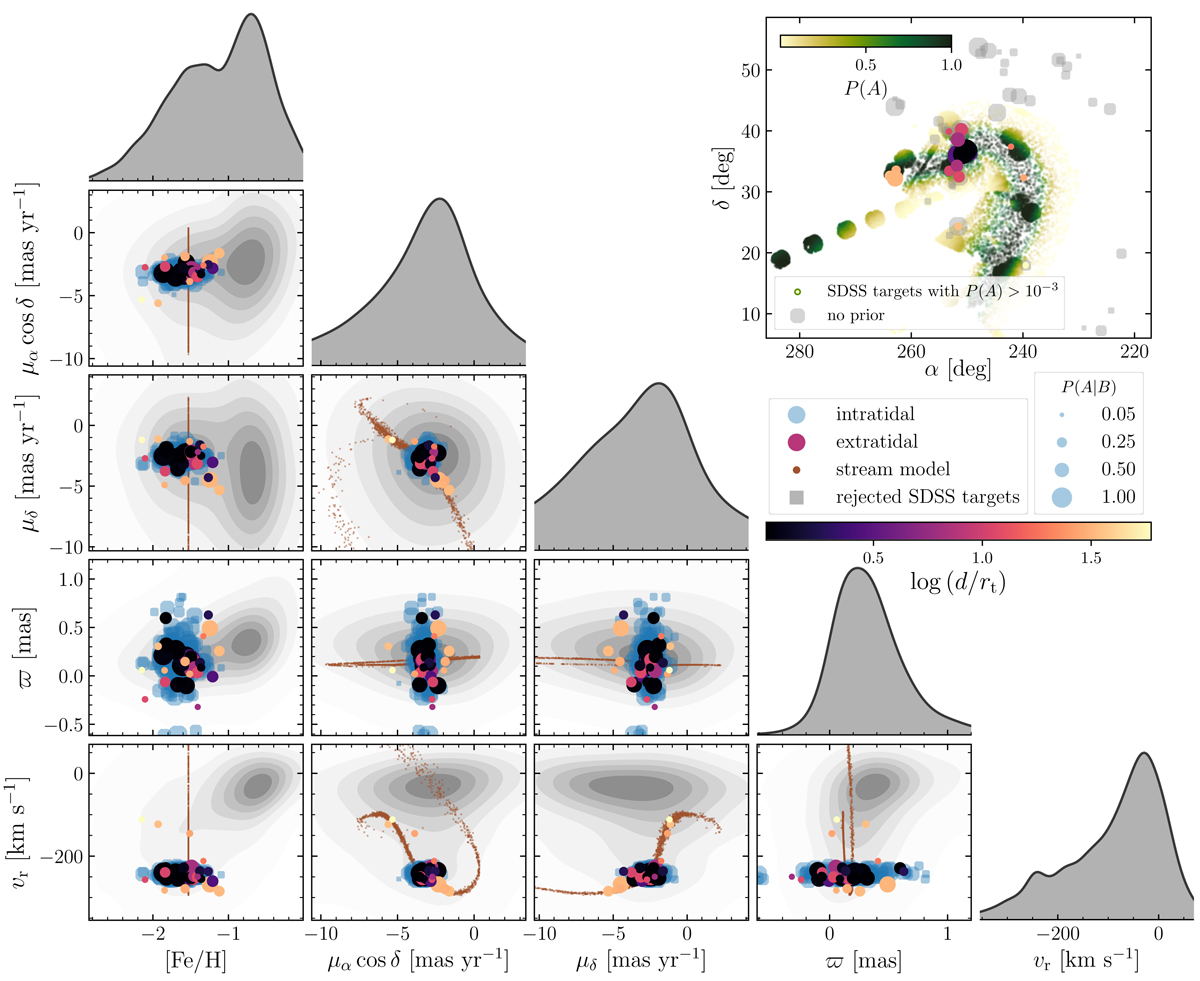
Five-parameter chemodynamical association criteria used to constrain the association with the GC M 13. The rejected back- and foreground population of stars with SSPP parameters and Gaia DR2 motions is indicated with gray density contours. Brown dots indicate the simulated stream (see main text). Intratidal and extratidal stars are depicted with blue and colored circles (see also Fig. 7), respectively. Circle sizes indicate the association probability and colors resemble the projected distance to the cluster center (see legend and color bar). The marginalized distributions of each coordinate on the abscissa are shown on top of the two-dimensional representations. The adopted spatial prior as well as the stars that are rejected due to its usage (gray circles with no colored counterpart) are illustrated in the upper right-hand panel.
Current usage metrics show cumulative count of Article Views (full-text article views including HTML views, PDF and ePub downloads, according to the available data) and Abstracts Views on Vision4Press platform.
Data correspond to usage on the plateform after 2015. The current usage metrics is available 48-96 hours after online publication and is updated daily on week days.
Initial download of the metrics may take a while.