Fig. 22.
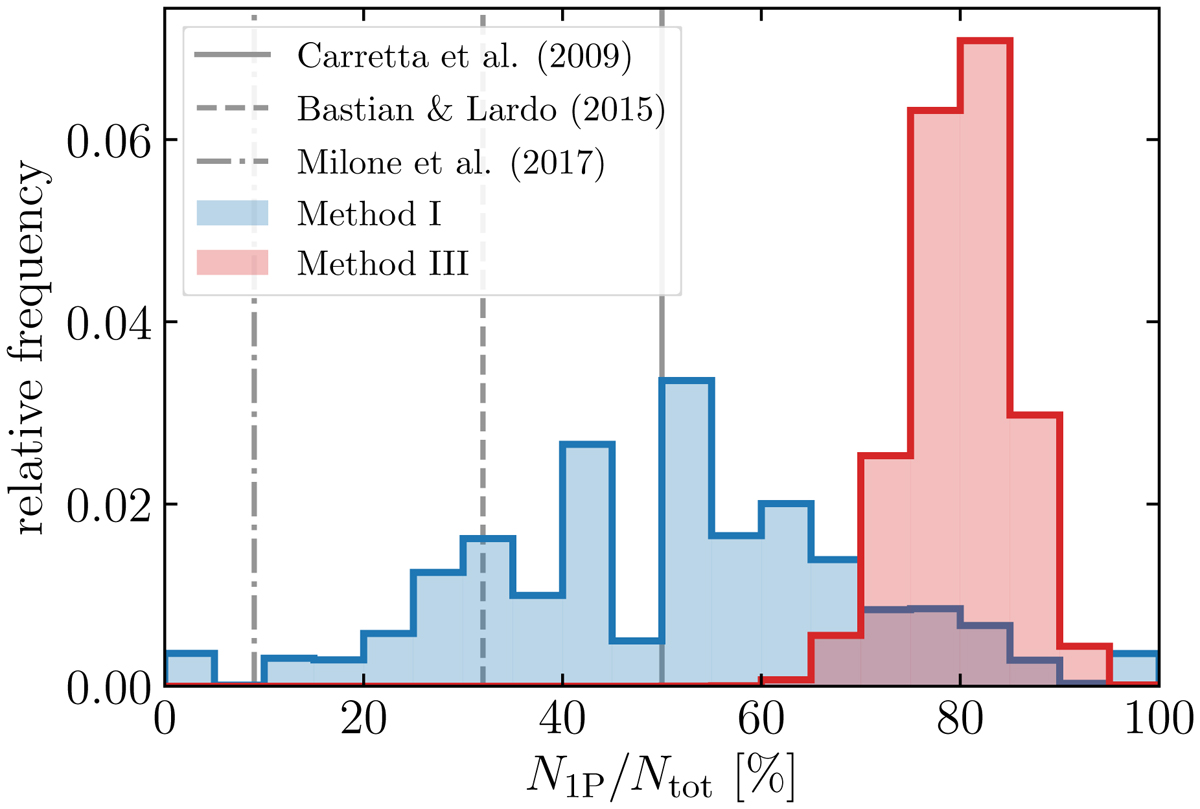
Result of an MC simulation with 107 realizations for the deduced fraction of first-generation stars among all potential GC escapees obeying the selection function in Paper I (Figs. 20 and 21). Here, the blue and red histograms represent the findings from methods I and III, respectively. For comparison, we indicate the fractions for bound cluster stars as reported by Carretta et al. (2009, solid vertical line), Bastian & Lardo (2015, dashed vertical line), and the lowest value from Milone et al. (2017, dash-dotted vertical line).
Current usage metrics show cumulative count of Article Views (full-text article views including HTML views, PDF and ePub downloads, according to the available data) and Abstracts Views on Vision4Press platform.
Data correspond to usage on the plateform after 2015. The current usage metrics is available 48-96 hours after online publication and is updated daily on week days.
Initial download of the metrics may take a while.