Fig. 21.
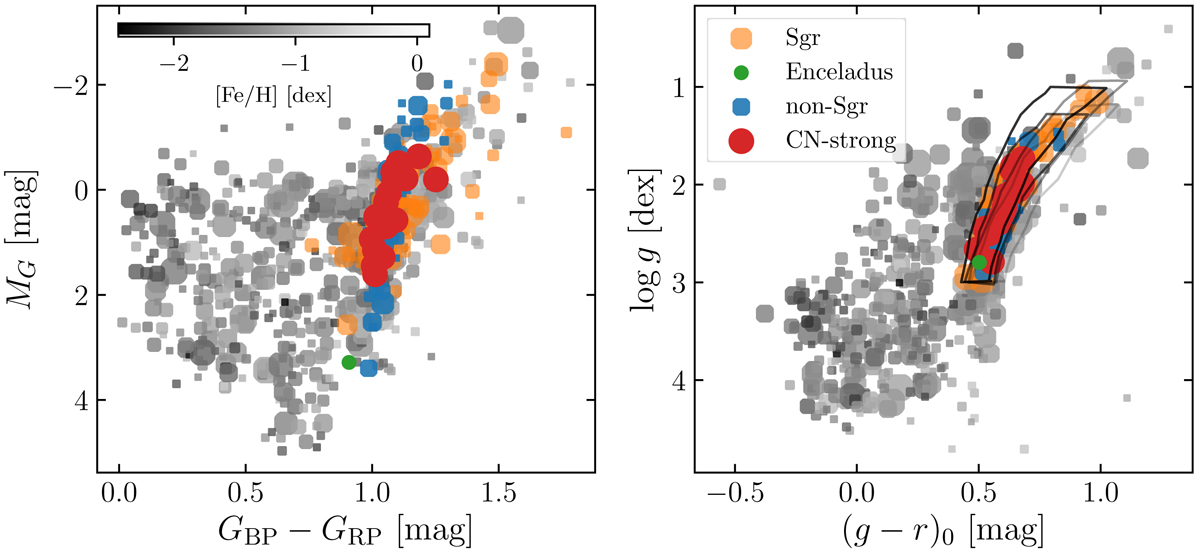
Same as Fig. 20 but for associations around CN-strong stars (method III). Here, MG was computed using the spectrophotometric distances of the CN-strong stars as outlined in Sect. 3.2. Orange and green circles show the associations with the Sgr stream and Gaia-Enceladus that obey the selection criteria of Paper I but were not considered when estimating the fraction N1P/Ntot.
Current usage metrics show cumulative count of Article Views (full-text article views including HTML views, PDF and ePub downloads, according to the available data) and Abstracts Views on Vision4Press platform.
Data correspond to usage on the plateform after 2015. The current usage metrics is available 48-96 hours after online publication and is updated daily on week days.
Initial download of the metrics may take a while.