Fig. 2.
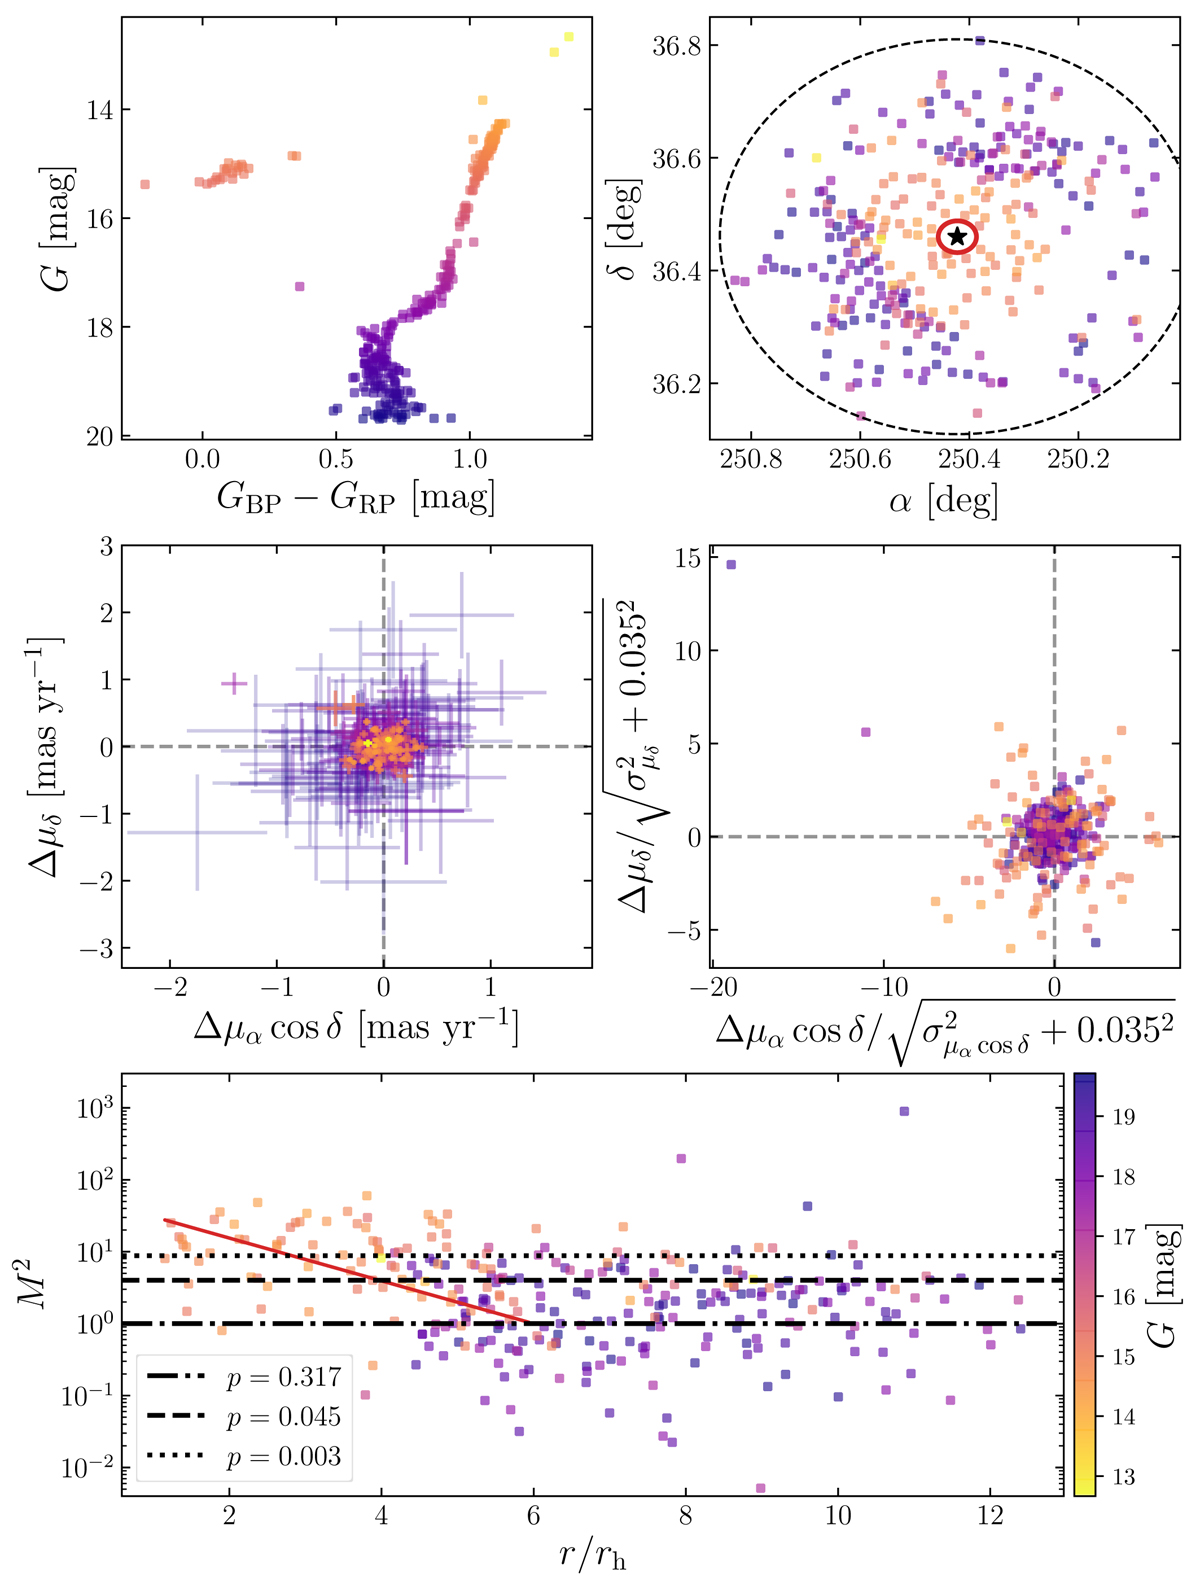
Upper left: same CMD as in Fig. 1, but with color coding indicating the brightness (see lower right color bar); the same color code is used in all other panels. Upper right: spatial distribution of the M 13 validation sample. The cluster core, half-light radius (1.69 arcmin), and tidal radius (21 arcmin) are represented by a black star, red circle, and black-dashed line, respectively. We emphasize that the tidal radius together with ϖ and vr were the only selection criteria applied to investigate proper motion systematic errors (main text). Middle panels: absolute (left) and relative (right) deviation in proper motion of the sample from the cluster mean value. Lower panel: squared Mahalanobis distance, M2, from proper motions only versus projected distance from the cluster center. In analogy to the 1σ, 2σ, and 3σ significances of a normal distribution, dash-dotted, dashed, and dotted lines represent the corresponding p-values (see legend). The red line denotes the scaling relation introduced in Eq. (4).
Current usage metrics show cumulative count of Article Views (full-text article views including HTML views, PDF and ePub downloads, according to the available data) and Abstracts Views on Vision4Press platform.
Data correspond to usage on the plateform after 2015. The current usage metrics is available 48-96 hours after online publication and is updated daily on week days.
Initial download of the metrics may take a while.