Fig. 10.
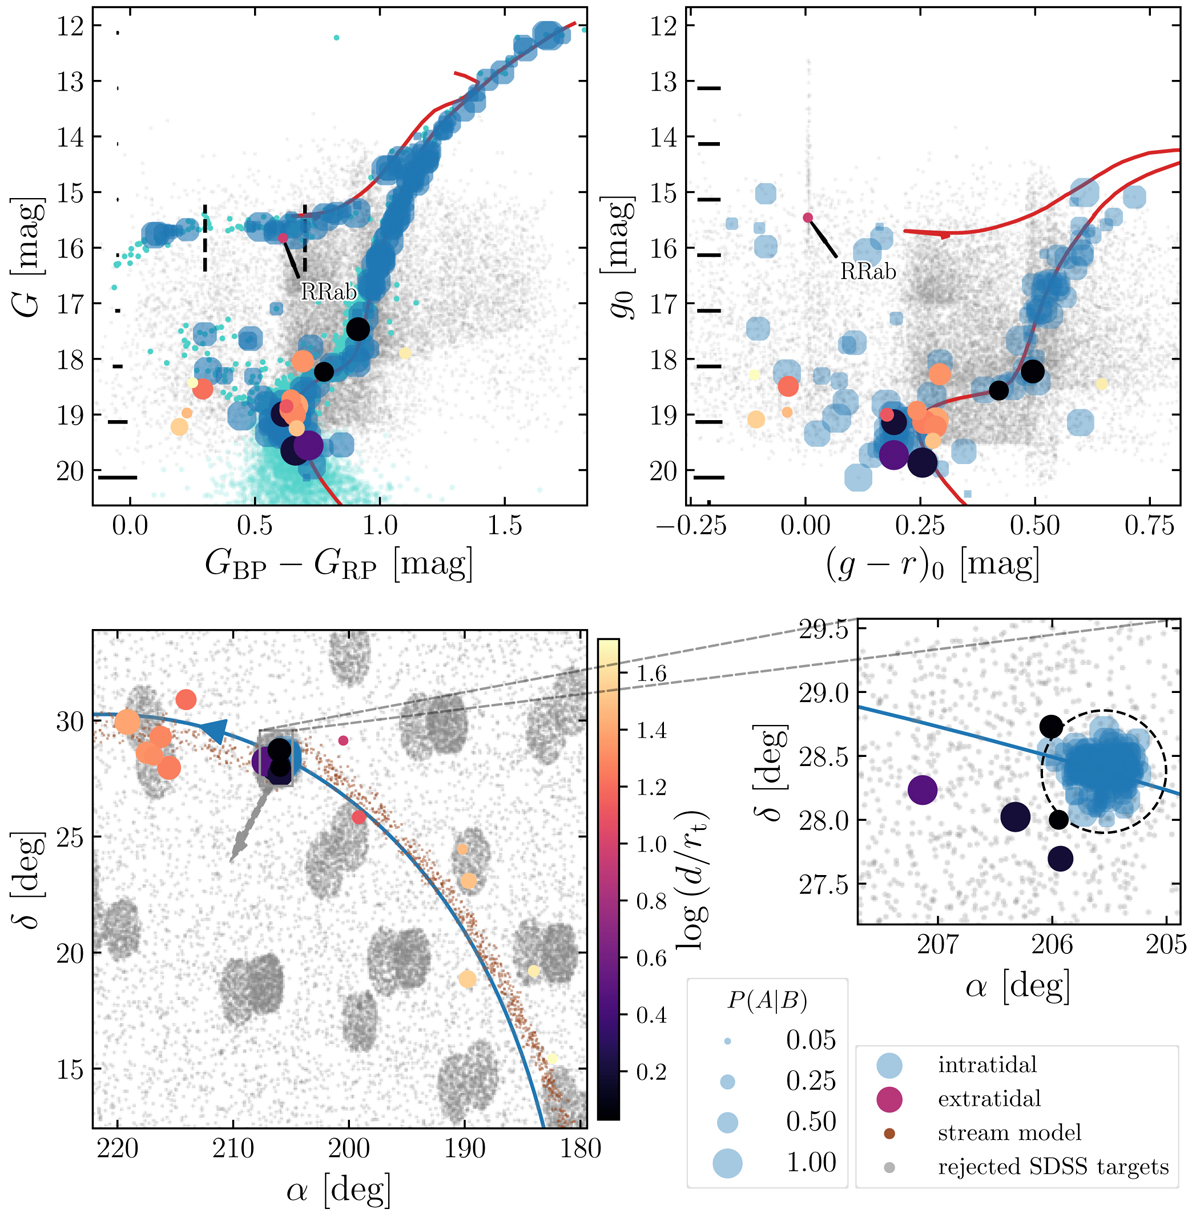
Same as Fig. 7, but for M 3. The approximate color range of the instability strip from Clementini et al. (2019) is indicated in the upper left panel by vertical dashed lines and the pulsating variable (see main text) is labeled “RRab”. We note that the illustrated color and brightness for the RR Lyrae star are merely mean quantities, which may vary substantially over the pulsation cycle.
Current usage metrics show cumulative count of Article Views (full-text article views including HTML views, PDF and ePub downloads, according to the available data) and Abstracts Views on Vision4Press platform.
Data correspond to usage on the plateform after 2015. The current usage metrics is available 48-96 hours after online publication and is updated daily on week days.
Initial download of the metrics may take a while.