Free Access
Fig. 6.
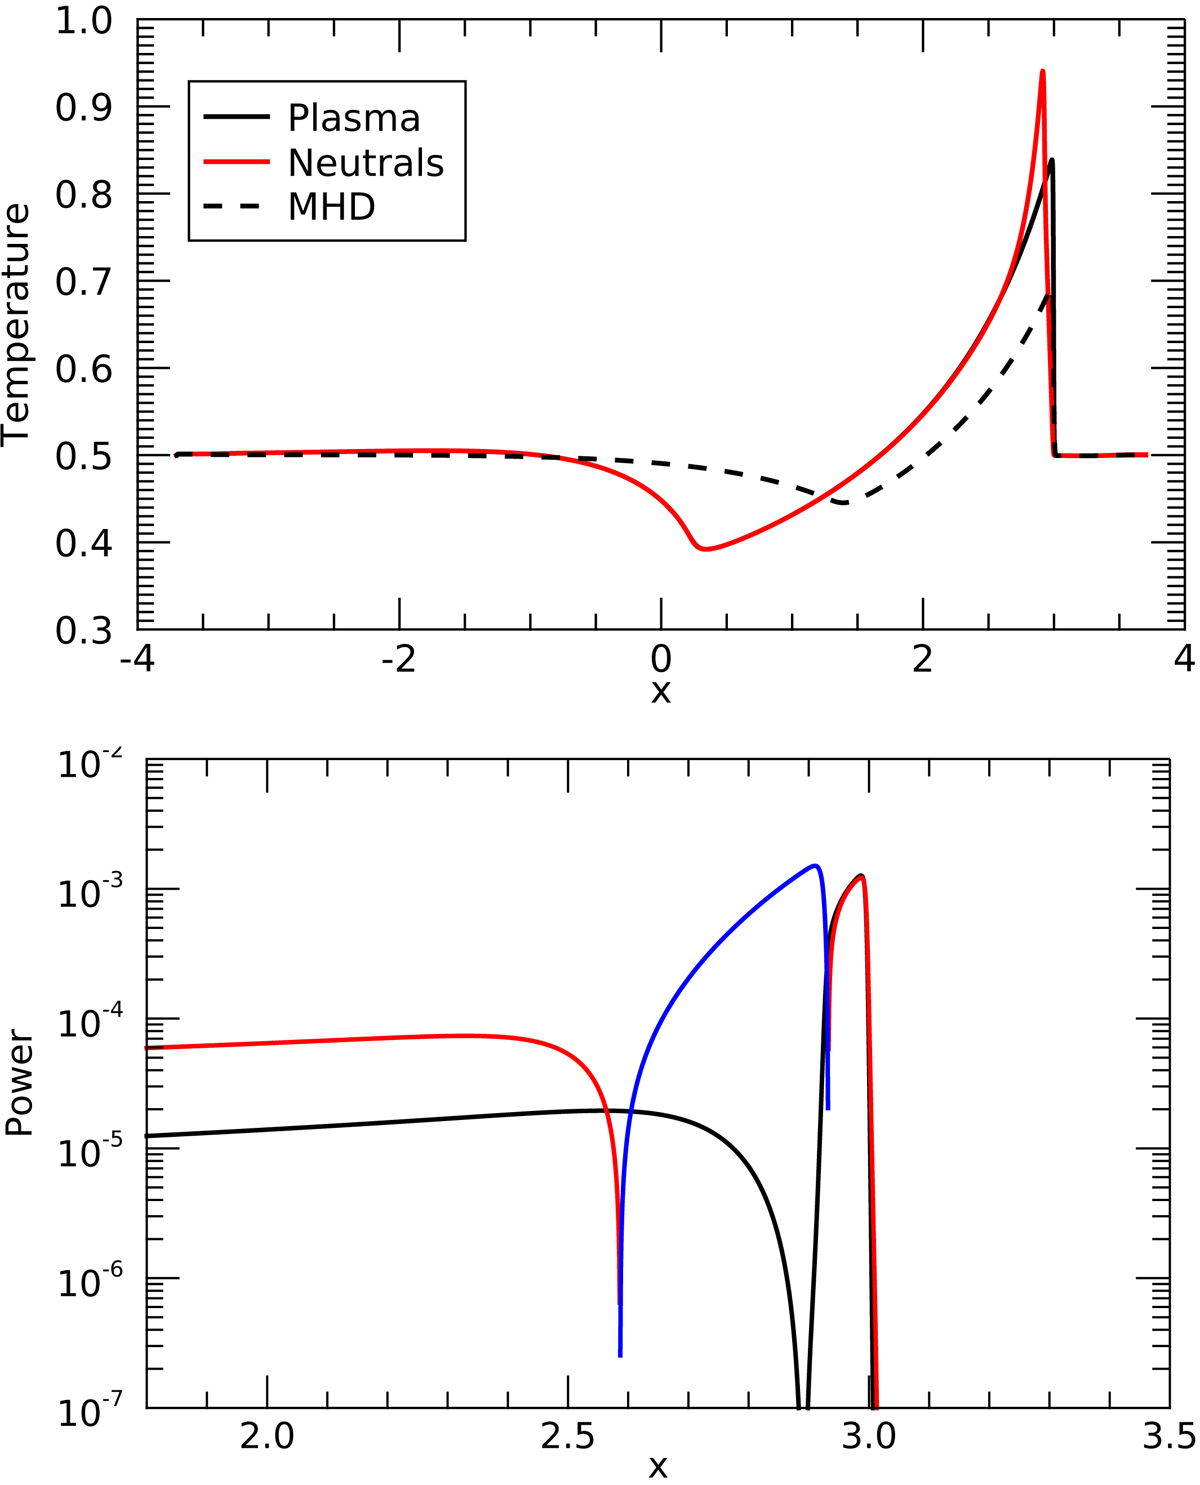
Top: temperature in the PIP simulation for the plasma (black) and neutral (red) species. The black dashed line shows the MHD temperature at the same time. Lower: frictional heating (black) and thermal damping (red and blue). Red line indicates ions losing heat to neutrals. Vice versa for the blue line.
Current usage metrics show cumulative count of Article Views (full-text article views including HTML views, PDF and ePub downloads, according to the available data) and Abstracts Views on Vision4Press platform.
Data correspond to usage on the plateform after 2015. The current usage metrics is available 48-96 hours after online publication and is updated daily on week days.
Initial download of the metrics may take a while.