Fig. 16.
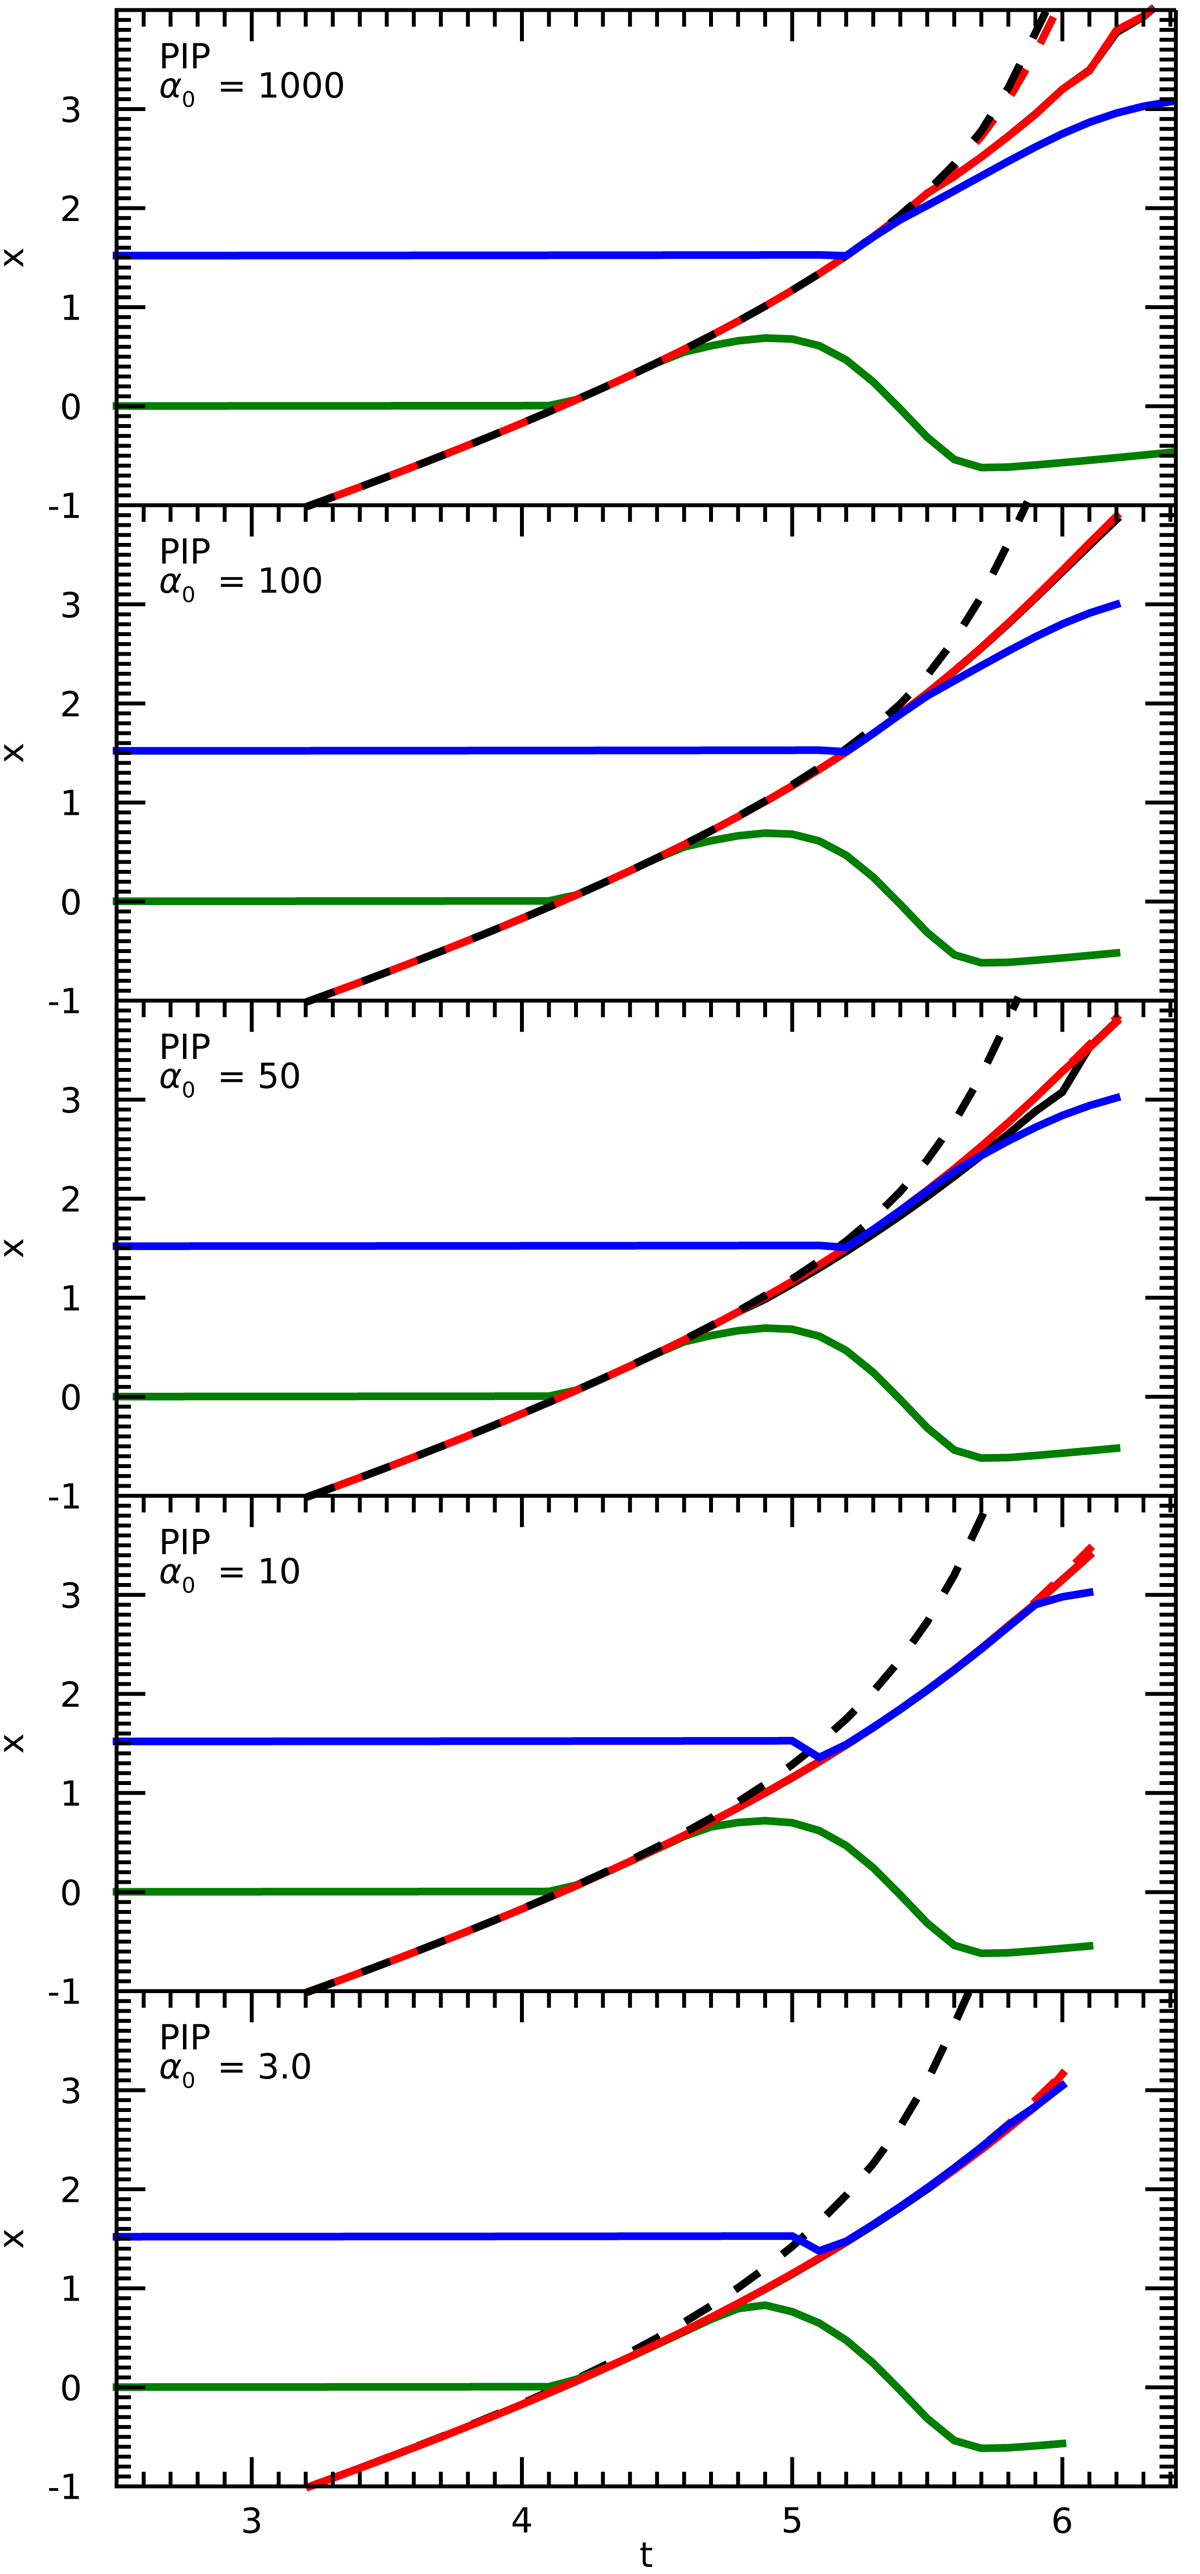
Shock locations through time for different collisional coupling coefficients. Parallel (solid) and perpendicular (dashed) velocities and shown for the plasma (black) and neutral (red) species. The βv and βvt locations are shown as the green and blue line respectively. The graph is plotted until the perpendicular shock approaches the top of the domain.
Current usage metrics show cumulative count of Article Views (full-text article views including HTML views, PDF and ePub downloads, according to the available data) and Abstracts Views on Vision4Press platform.
Data correspond to usage on the plateform after 2015. The current usage metrics is available 48-96 hours after online publication and is updated daily on week days.
Initial download of the metrics may take a while.