Fig. 12.
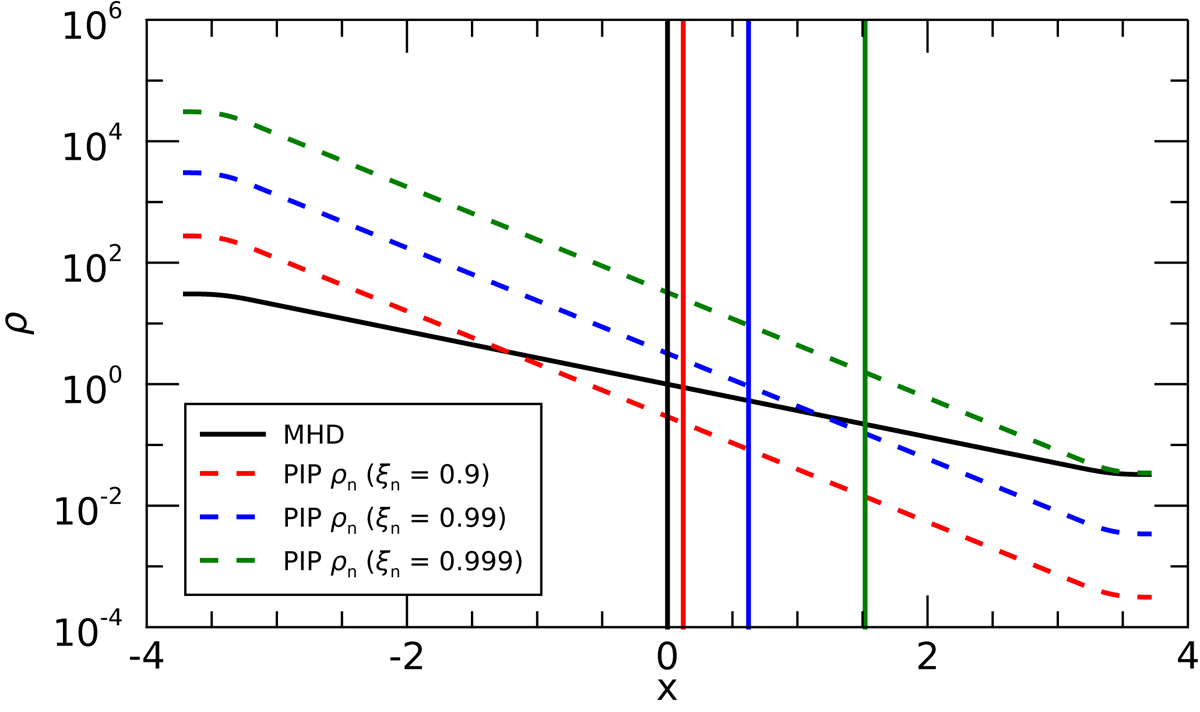
Plasma (solid black) and neutral (dashed) densities with height for ξn0 = 0.9 (red), 0.99 (blue), and 0.999 (green). The MHD density is given by the black line and the plasma component of the two-fluid simulation is identical to the MHD density profile. The vertical line indicate the βv point (where cs = vA) for the plasma species (and MHD) only. The coloured vertical lines show the βvt points using the total densities (ρn + ρp), that is, cst = vAt.
Current usage metrics show cumulative count of Article Views (full-text article views including HTML views, PDF and ePub downloads, according to the available data) and Abstracts Views on Vision4Press platform.
Data correspond to usage on the plateform after 2015. The current usage metrics is available 48-96 hours after online publication and is updated daily on week days.
Initial download of the metrics may take a while.