Fig. 6.
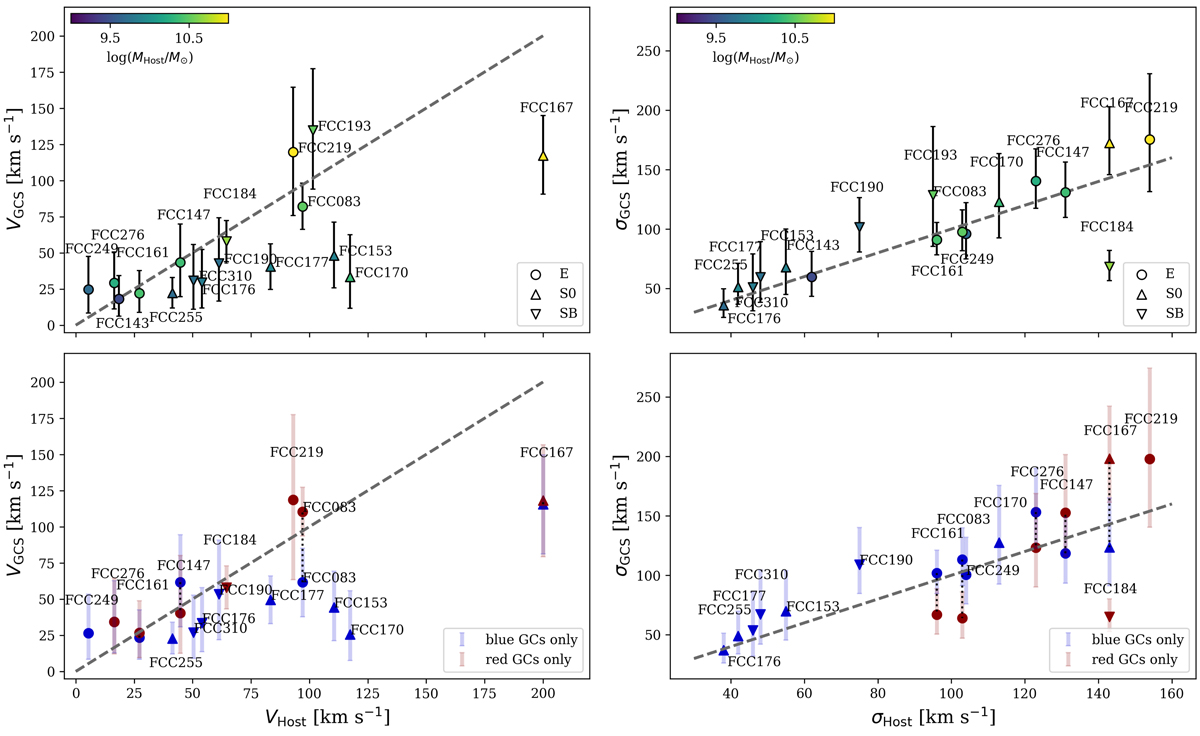
GC rotation velocities (left) and velocity dispersions (right) compared to the stellar body of the galaxies. The stellar rotation amplitudes and velocity dispersions were extracted from the kinematic maps at 1 Reff where possible. Upper panels: VGCS and σGCS for the total GCS. The colour gives the stellar mass of the host galaxy and the symbols show the galaxy morphology. Bottom panel: values, when only the red or blue GCs were modelled. For galaxies with more than 10 GCs in either population, a dotted line connects the values. The dashed line in all panels gives the one-to-one relation. FCC 213 is not shown because no kinematic map was available.
Current usage metrics show cumulative count of Article Views (full-text article views including HTML views, PDF and ePub downloads, according to the available data) and Abstracts Views on Vision4Press platform.
Data correspond to usage on the plateform after 2015. The current usage metrics is available 48-96 hours after online publication and is updated daily on week days.
Initial download of the metrics may take a while.