Fig. 4.
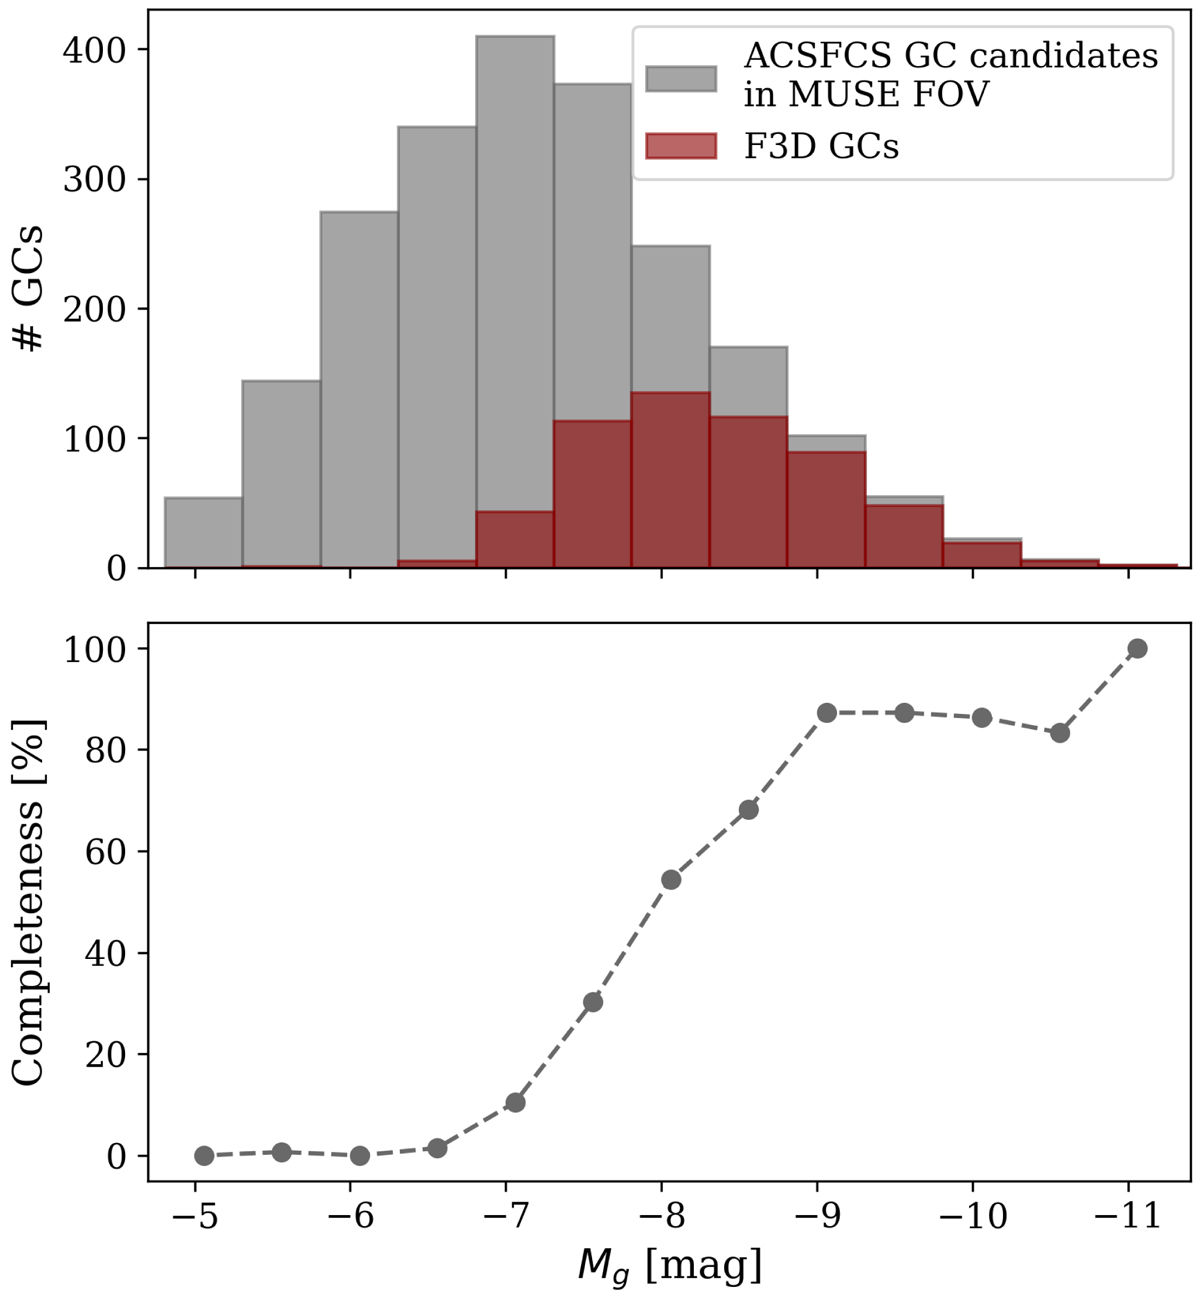
Completeness of the F3D GC catalogue with respect to the ACSFCS catalogue (Jordán et al. 2015). Top: histogram of absolute g-band magnitudes. The grey bins show all ACSFCS GC candidates located in the MUSE FOVs of F3D. Those, that are confirmed GCs and are in our F3D catalogue are shown by the red bins. Bottom: completeness as ratio of number of GCs in F3D and all ACSFCS candidates as function of total g-band magnitude.
Current usage metrics show cumulative count of Article Views (full-text article views including HTML views, PDF and ePub downloads, according to the available data) and Abstracts Views on Vision4Press platform.
Data correspond to usage on the plateform after 2015. The current usage metrics is available 48-96 hours after online publication and is updated daily on week days.
Initial download of the metrics may take a while.