Fig. B.1.
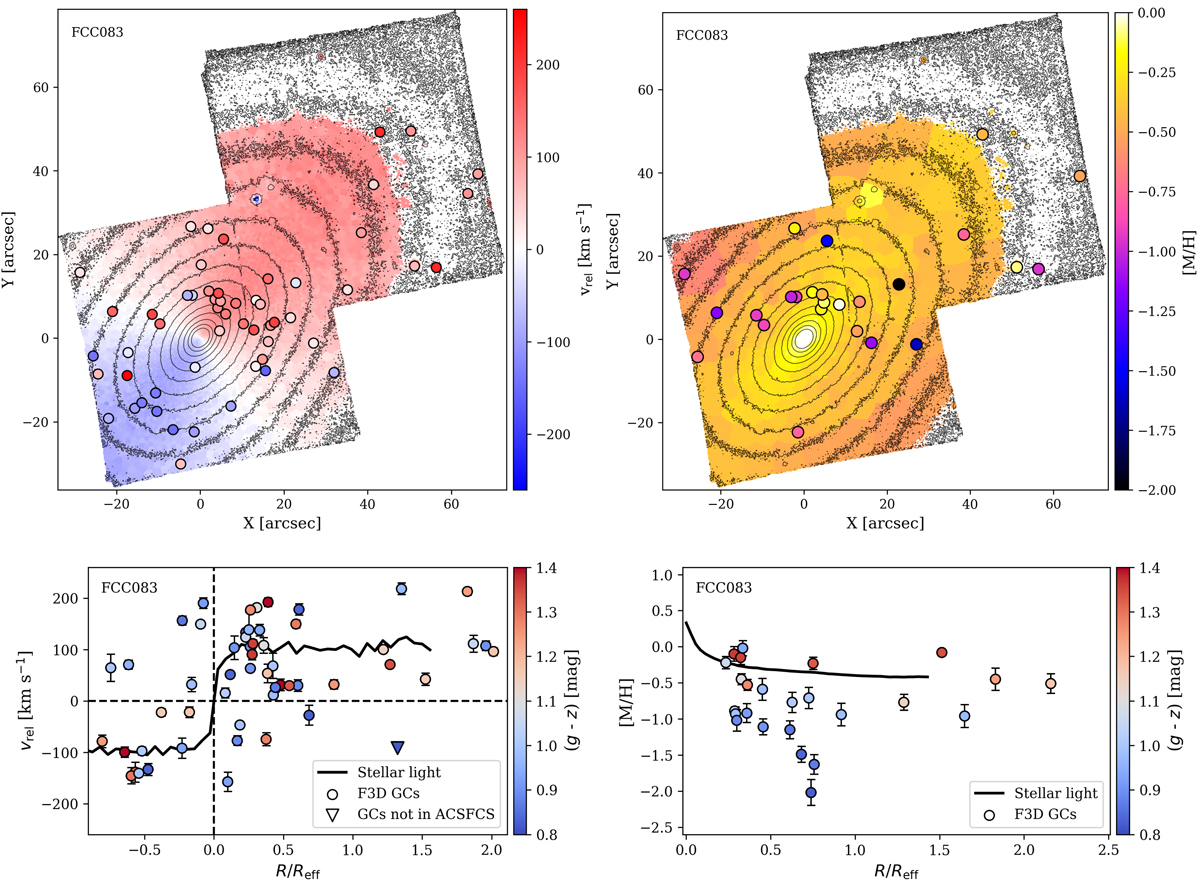
GCs of FCC 083 in comparison to the host galaxy. Top panels: GC velocities (left) and metallicites (right) shown as circles on top of the Voronoi-binned maps presented in Iodice et al. (2019a). The black contours indicate the surface brightness levels from the original MUSE cube to guide the eye. Bottom left: GC LOS velocities versus galactocentric distance projected on the major axis; bottom right: radial GC metallicity profile. The circles show the GCs, colour-coded by (g−z) from the ACSFCS. GCs that were not covered in the catalogue of Jordán et al. (2015) are shown by triangles. The black line refers to the profile from the stellar light.
Current usage metrics show cumulative count of Article Views (full-text article views including HTML views, PDF and ePub downloads, according to the available data) and Abstracts Views on Vision4Press platform.
Data correspond to usage on the plateform after 2015. The current usage metrics is available 48-96 hours after online publication and is updated daily on week days.
Initial download of the metrics may take a while.