Fig. 1.
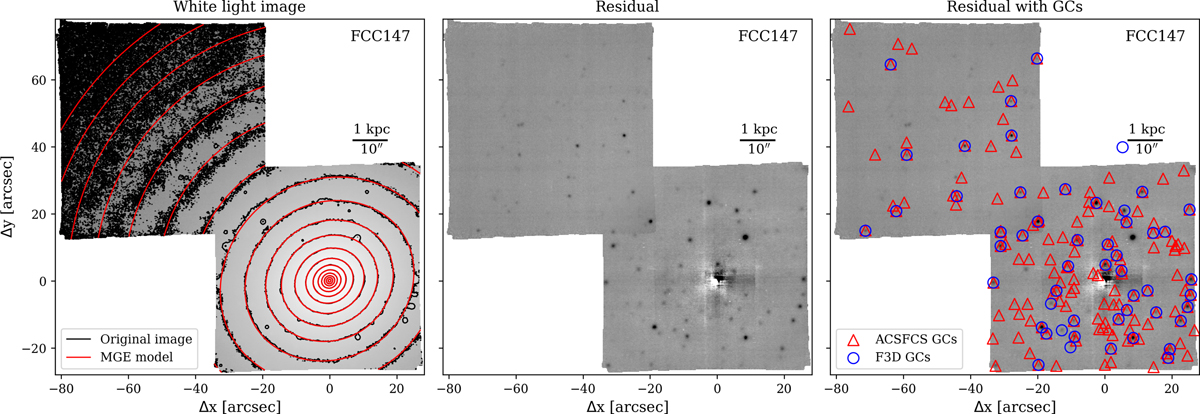
Illustration of the MGE modelling used to create residual images in which GCs were detected. Left: collapsed MUSE image of FCC 147. Black and red contours illustrate isophotes of the original image and the MGE model, respectively. Middle: residual image after subtracting the model from the image. Otherwise hidden point sources are now visible. Right: residual with GC highlighted. Red triangles show the position of GC candidates from the ACSFCS catalogue (Jordán et al. 2015). The blue circles show the position of confirmed F3D GCs in FCC 147.
Current usage metrics show cumulative count of Article Views (full-text article views including HTML views, PDF and ePub downloads, according to the available data) and Abstracts Views on Vision4Press platform.
Data correspond to usage on the plateform after 2015. The current usage metrics is available 48-96 hours after online publication and is updated daily on week days.
Initial download of the metrics may take a while.