Open Access
Fig. 5
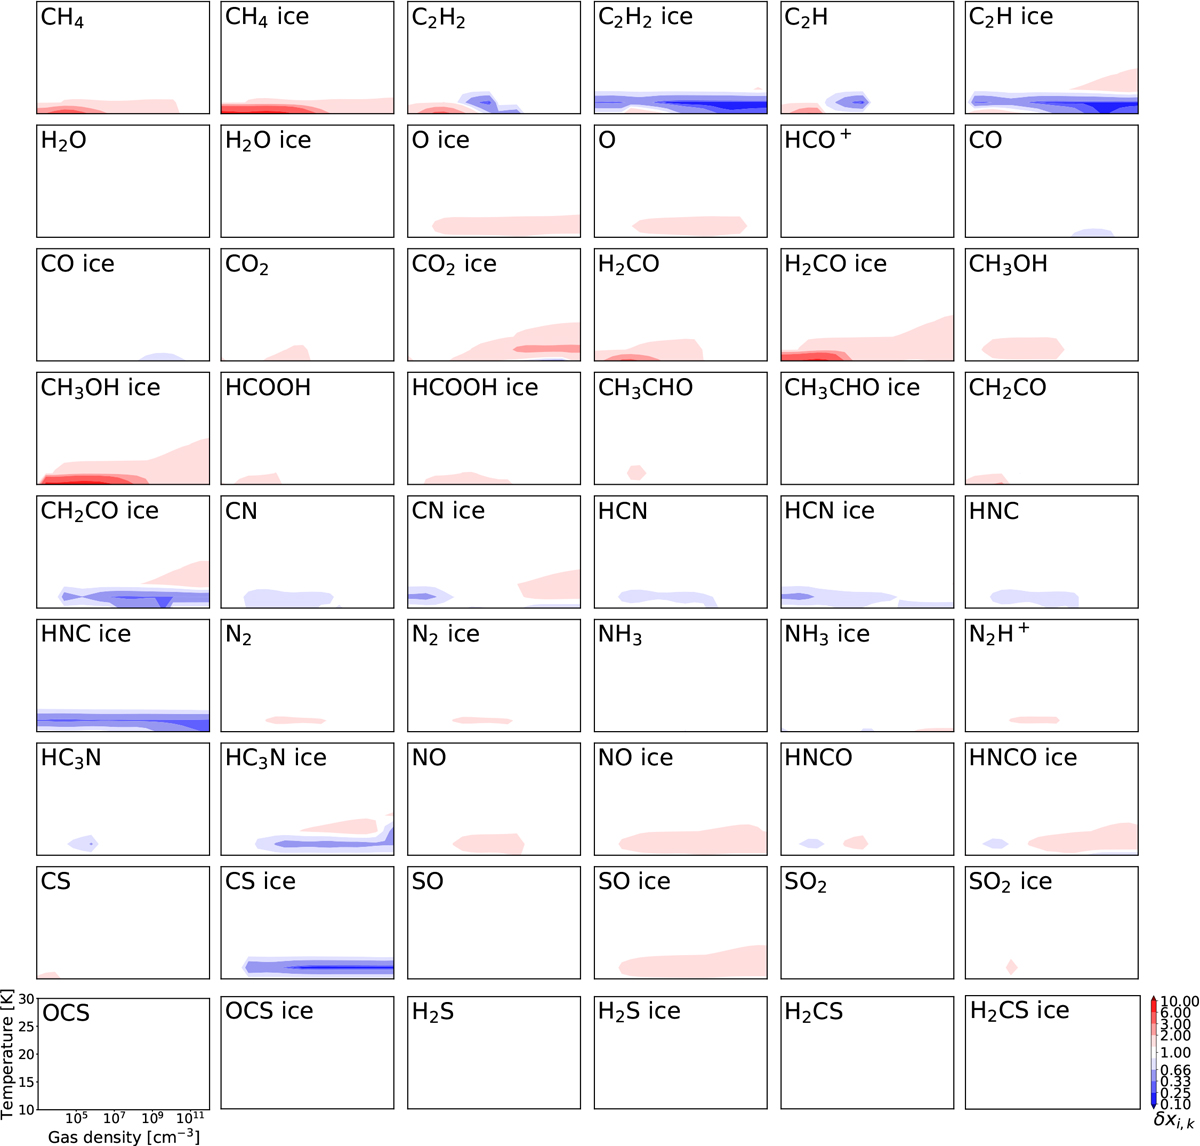
Abundance ratios δx between the modified and original networks are shown for the entire 2D physical grid at tj = 106 yr for selected observed species. The results are depicted for the AV = 3 mag case.
Current usage metrics show cumulative count of Article Views (full-text article views including HTML views, PDF and ePub downloads, according to the available data) and Abstracts Views on Vision4Press platform.
Data correspond to usage on the plateform after 2015. The current usage metrics is available 48-96 hours after online publication and is updated daily on week days.
Initial download of the metrics may take a while.