Free Access
Fig. 6.
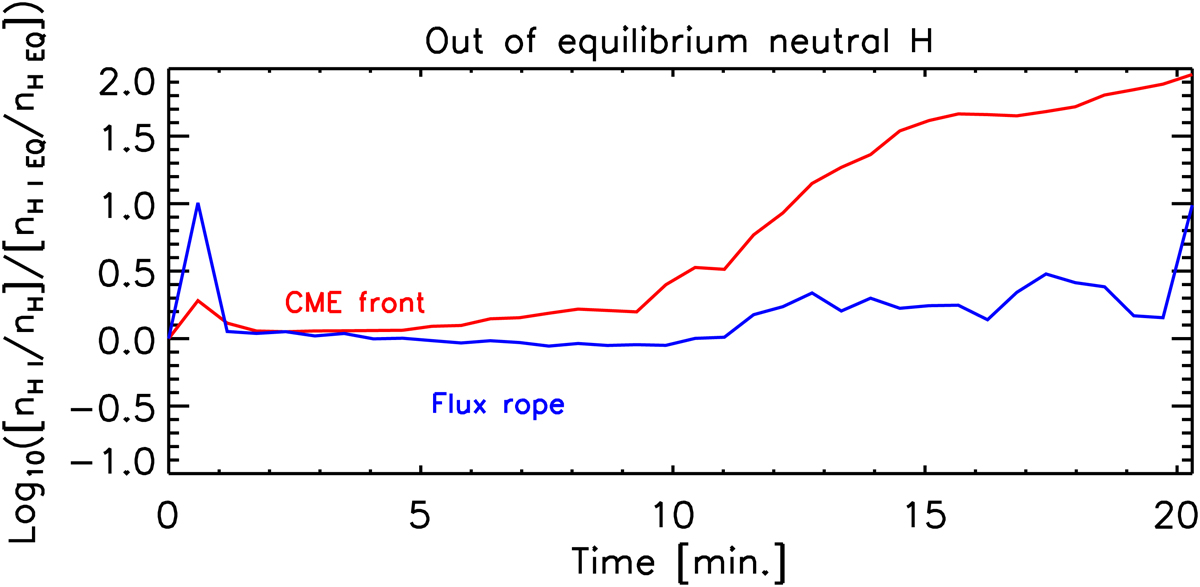
Time evolution of relative abundance of neutral hydrogen atoms in the CME front (red line) and in the CME core (blue line); the curves show the comparison between the ionisation equilibrium and non-equilibrium ionisation cases at each time.
Current usage metrics show cumulative count of Article Views (full-text article views including HTML views, PDF and ePub downloads, according to the available data) and Abstracts Views on Vision4Press platform.
Data correspond to usage on the plateform after 2015. The current usage metrics is available 48-96 hours after online publication and is updated daily on week days.
Initial download of the metrics may take a while.