Fig. 5.
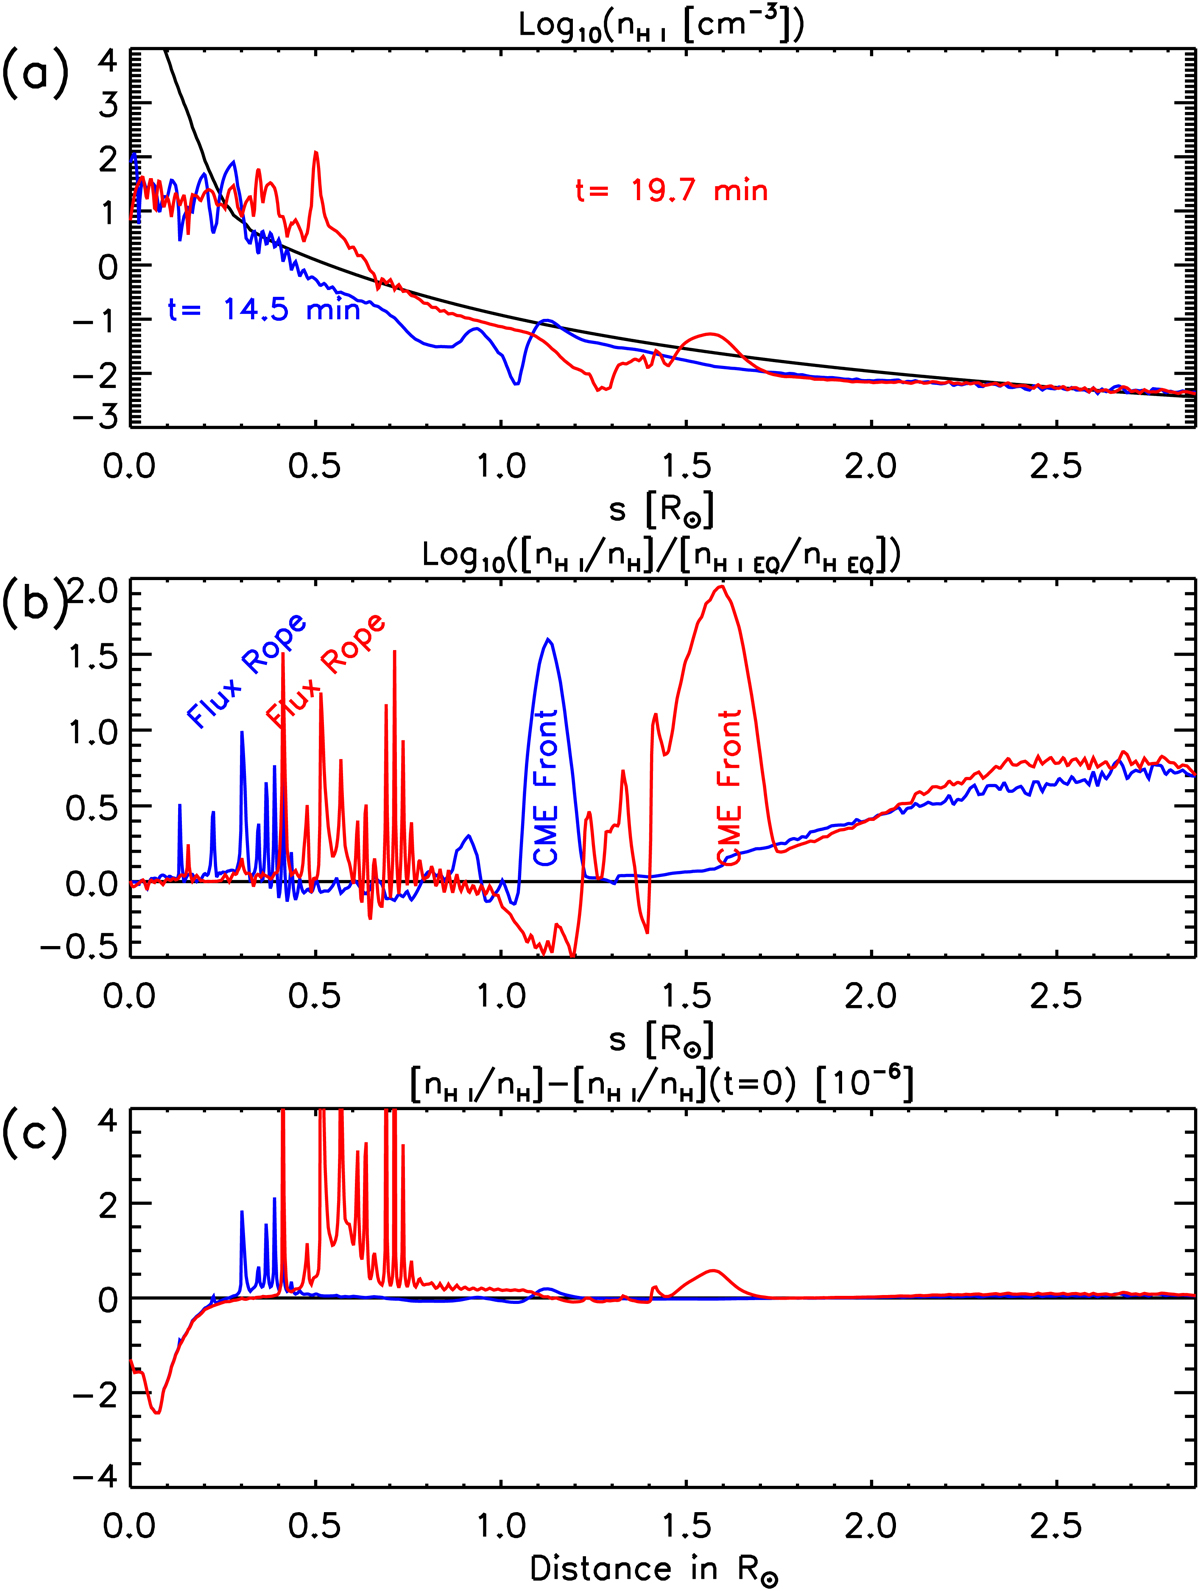
(a) Radial profiles of neutral hydrogen atoms along the flux rope propagation direction in the pre-CME corona (black line) and during the eruption at t = 14.5 min (blue line) and t = 19.7 min (red line). (b) Comparison between ionisation equilibrium and non-equilibrium ionisation cases at the same times, with labelled positions of the flux rope and CME front at different times. (c) Changes in relative abundance of neutral hydrogen at the same cuts and the same times.
Current usage metrics show cumulative count of Article Views (full-text article views including HTML views, PDF and ePub downloads, according to the available data) and Abstracts Views on Vision4Press platform.
Data correspond to usage on the plateform after 2015. The current usage metrics is available 48-96 hours after online publication and is updated daily on week days.
Initial download of the metrics may take a while.