Fig. 4.
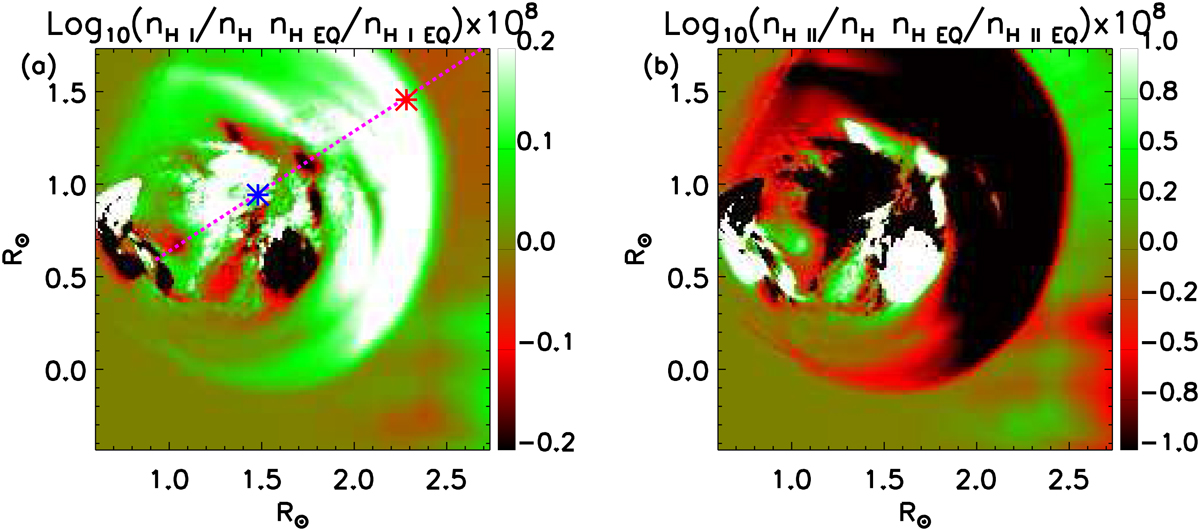
Difference of the logarithms of the ionisation fraction for neutral (a) and ionised (b) hydrogen atoms with respect to the values provided under the hypothesis of ionisation equilibrium at t = 19.7 min. The magenta line shows the trajectory of the CME on the plane of sky. Also, the blue and red asterisks denote the positions of the magnetic flux rope and of the CME front at this time, respectively.
Current usage metrics show cumulative count of Article Views (full-text article views including HTML views, PDF and ePub downloads, according to the available data) and Abstracts Views on Vision4Press platform.
Data correspond to usage on the plateform after 2015. The current usage metrics is available 48-96 hours after online publication and is updated daily on week days.
Initial download of the metrics may take a while.