Fig. 8.
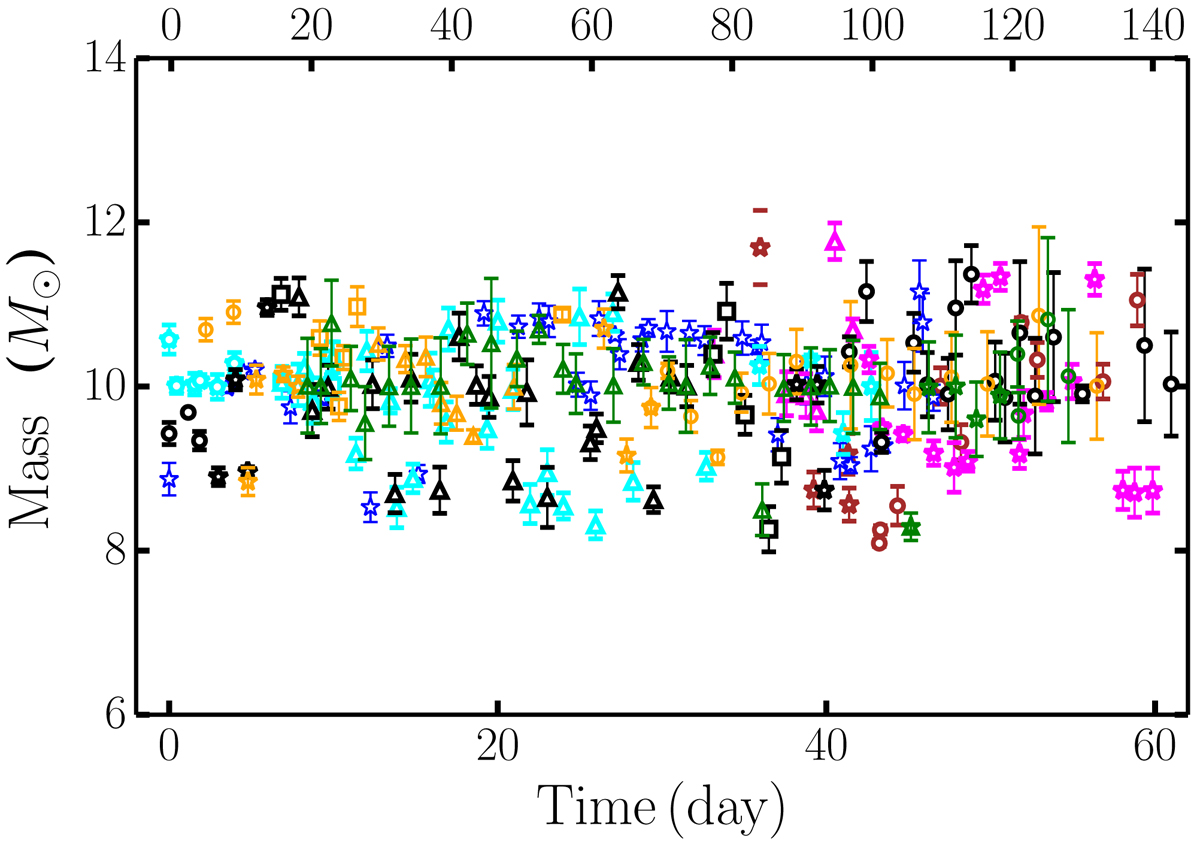
Mass of the source estimated from two-component flow model for different outbursts are plotted. Different colours and symbols have the same meaning as in Fig. 2. The uncertainty in mass is quoted within the 90% confidence range and is marked within the symbols. The time axis on top is applicable to only the 2004 outburst (green points).
Current usage metrics show cumulative count of Article Views (full-text article views including HTML views, PDF and ePub downloads, according to the available data) and Abstracts Views on Vision4Press platform.
Data correspond to usage on the plateform after 2015. The current usage metrics is available 48-96 hours after online publication and is updated daily on week days.
Initial download of the metrics may take a while.