Fig. 2.
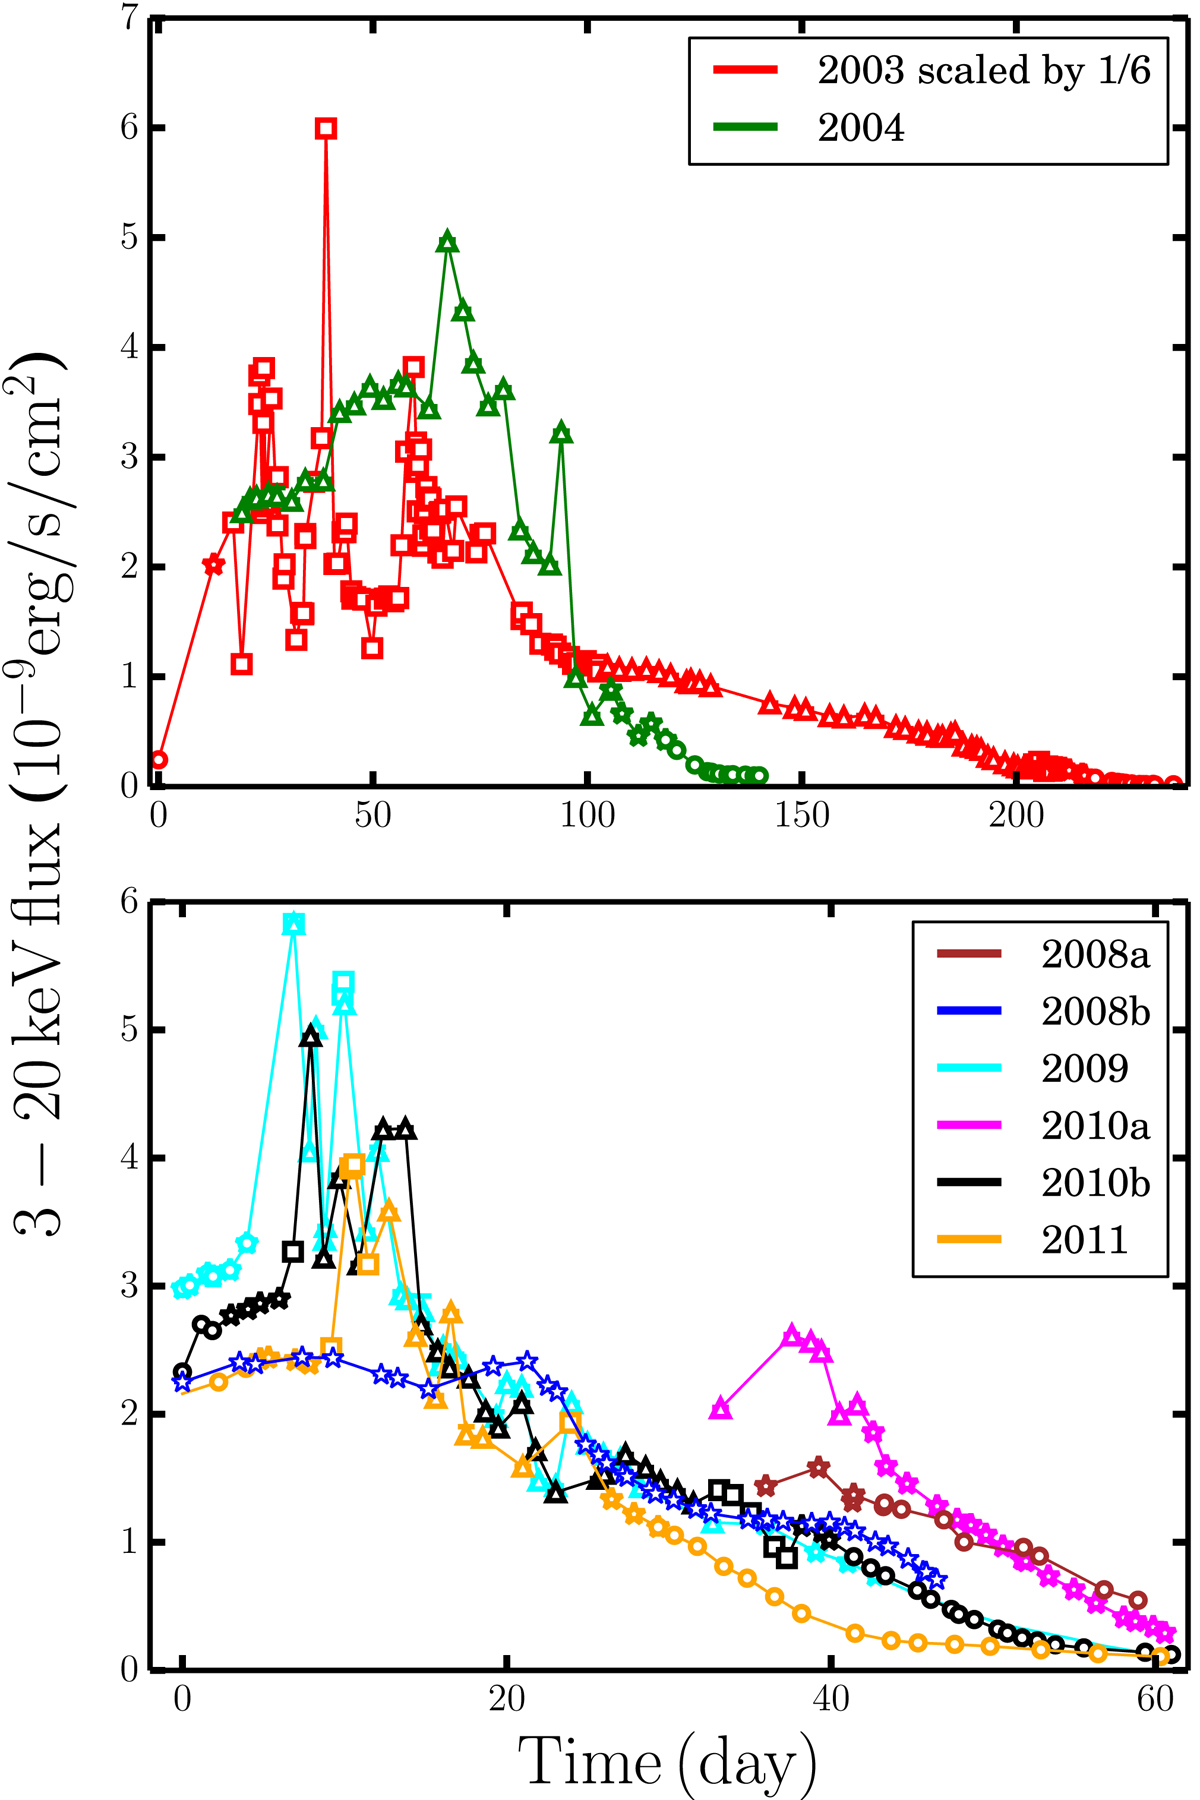
RXTE/PCA 3.0−20.0 keV lightcurves of H1743−322 outbursts in the period 2003−2011 are drawn. The lines with different colours show different outbursts: 2003 (red); 2004 (green); 2008a (brown); 2008b (blue); 2009 (cyan); 2010a (magenta); 2010b (black); and 2011 (orange). The different symbols represent spectral states as follows: LHS (circles); HIMS (star); SIMS (square); and HSS (triangle).
Current usage metrics show cumulative count of Article Views (full-text article views including HTML views, PDF and ePub downloads, according to the available data) and Abstracts Views on Vision4Press platform.
Data correspond to usage on the plateform after 2015. The current usage metrics is available 48-96 hours after online publication and is updated daily on week days.
Initial download of the metrics may take a while.