Fig. 15.
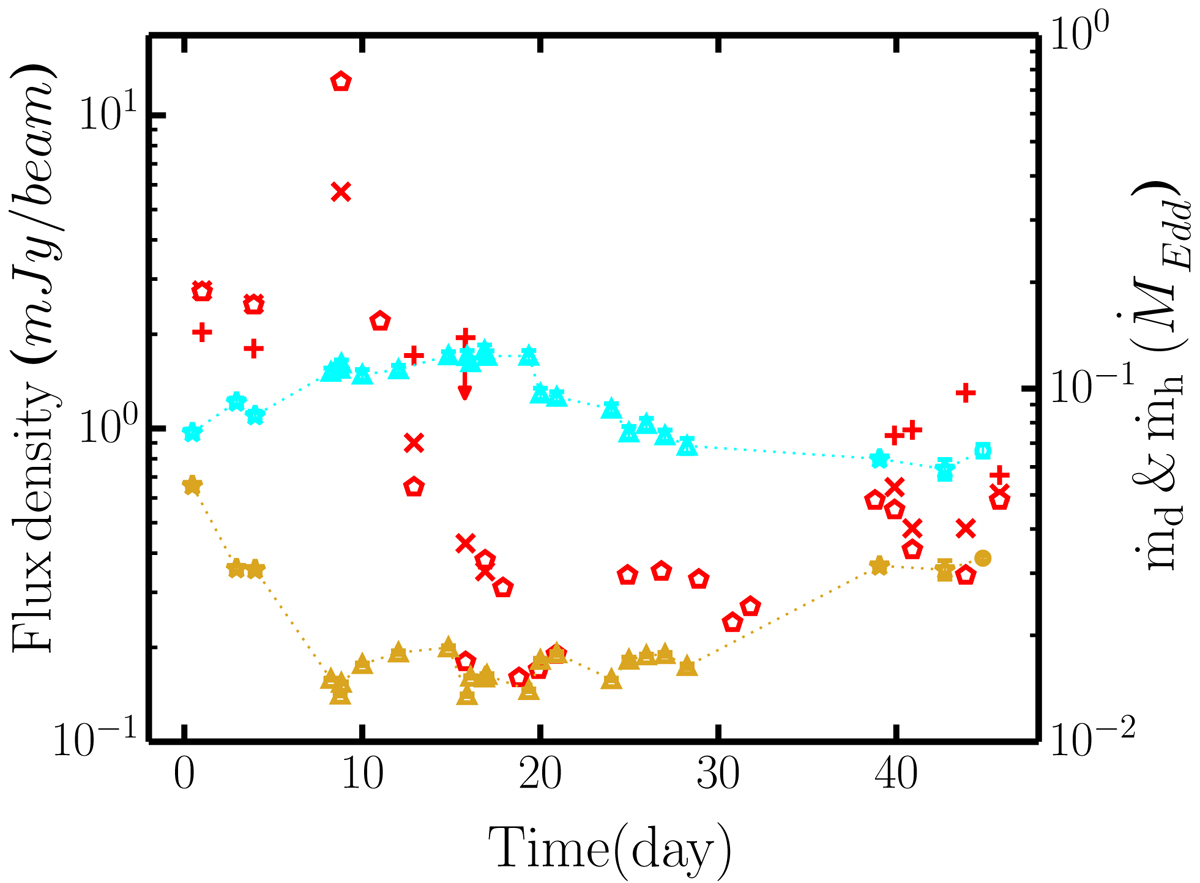
Evolution of radio flux density (red) along with the Keplerian disc accretion rate (cyan) and sub-Keplerian accretion rate (gold) are presented for the 2009 outburst. The symbols in red represent the radio flux density at 1.4 GHz (plus), 4.9 GHz (cross), and 8.4 GHz (pentagon), respectively. The 3σ upper limit of the 1.4 GHz radio data on MJD 54996.2 is indicated by a downward arrow. The accretion rates in different spectral states are denoted by the same symbols (triangle for HSS and star for HIMS) throughout the paper. The left vertical axis represents the radio flux density, whereas the right vertical axis shows the accretion rates.
Current usage metrics show cumulative count of Article Views (full-text article views including HTML views, PDF and ePub downloads, according to the available data) and Abstracts Views on Vision4Press platform.
Data correspond to usage on the plateform after 2015. The current usage metrics is available 48-96 hours after online publication and is updated daily on week days.
Initial download of the metrics may take a while.