Fig. 13.
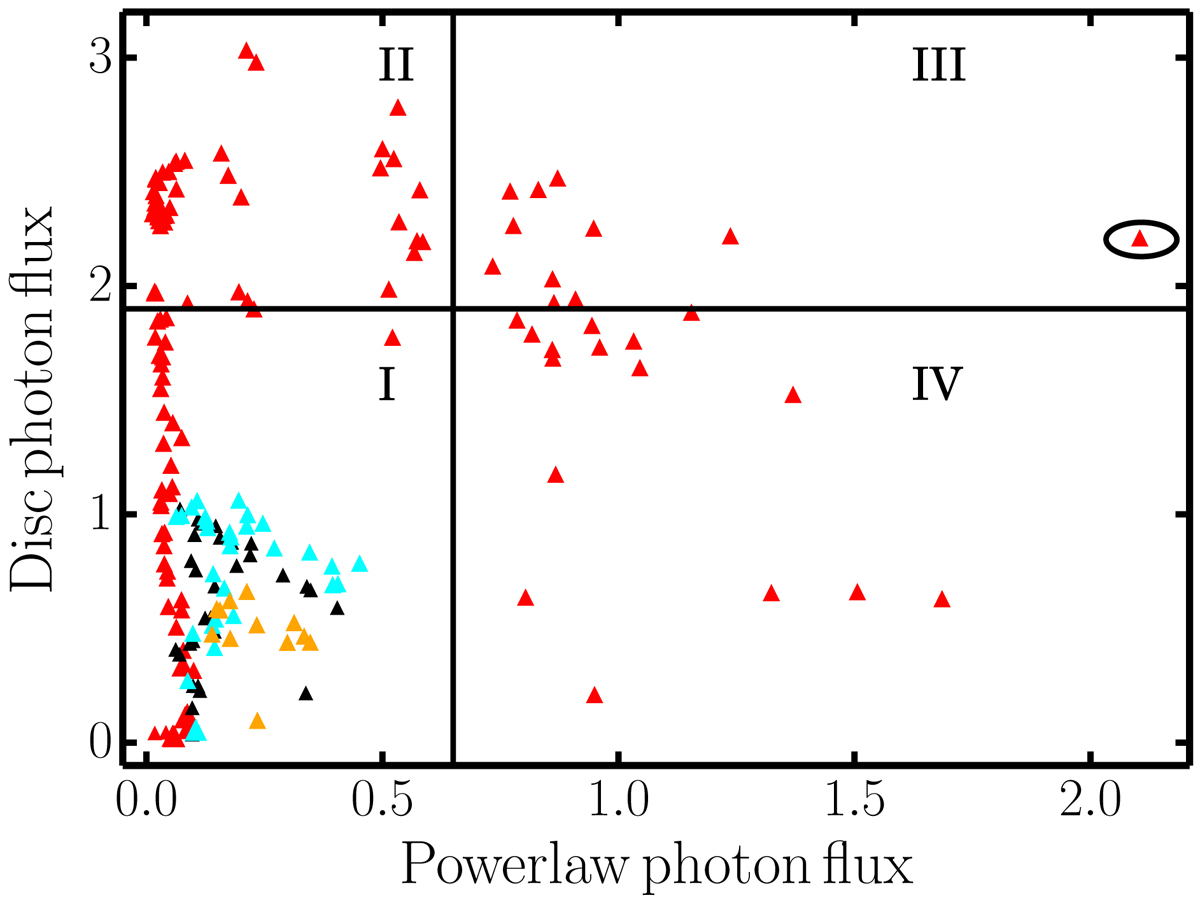
Blackbody photon flux and the powerlaw photon flux required to model the data when both components are present. The outburst data with full PCA coverage are plotted as: 2003 (red), 2009 (cyan), 2010b (black), and 2011 (orange). The different regions (I−IV) represent the validity of the current model and possible modifications (see text for details). The data point marked by a small ellipse corresponds to the highest peak of the 2003 outburst and was modelled by the modified two-component model (see Fig. 14).
Current usage metrics show cumulative count of Article Views (full-text article views including HTML views, PDF and ePub downloads, according to the available data) and Abstracts Views on Vision4Press platform.
Data correspond to usage on the plateform after 2015. The current usage metrics is available 48-96 hours after online publication and is updated daily on week days.
Initial download of the metrics may take a while.