Fig. 10.
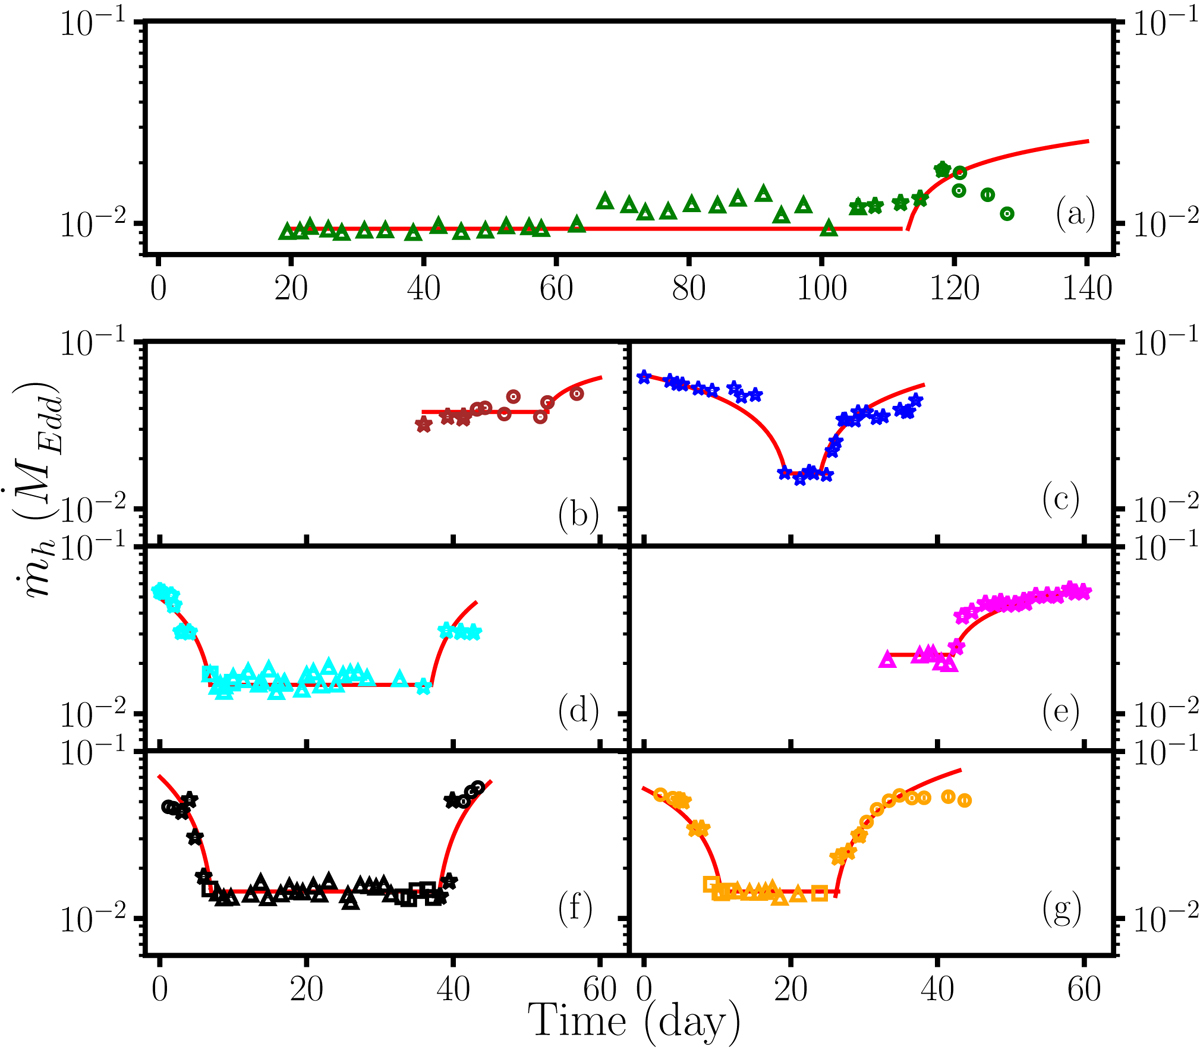
Evolution of sub-Keplerian accretion rate for the (a) 2004, (b) 2008a, (c) 2008b, (d) 2009, (e) 2010a, (f) 2010b, and (g) 2011 outbursts of H1743−322. The red solid line represents model fitting using Eq. (2). Different colours and symbols have the same meaning as in Fig. 2. We marked the 90% uncertainty of the parameter within the symbol.
Current usage metrics show cumulative count of Article Views (full-text article views including HTML views, PDF and ePub downloads, according to the available data) and Abstracts Views on Vision4Press platform.
Data correspond to usage on the plateform after 2015. The current usage metrics is available 48-96 hours after online publication and is updated daily on week days.
Initial download of the metrics may take a while.