Fig. 3.
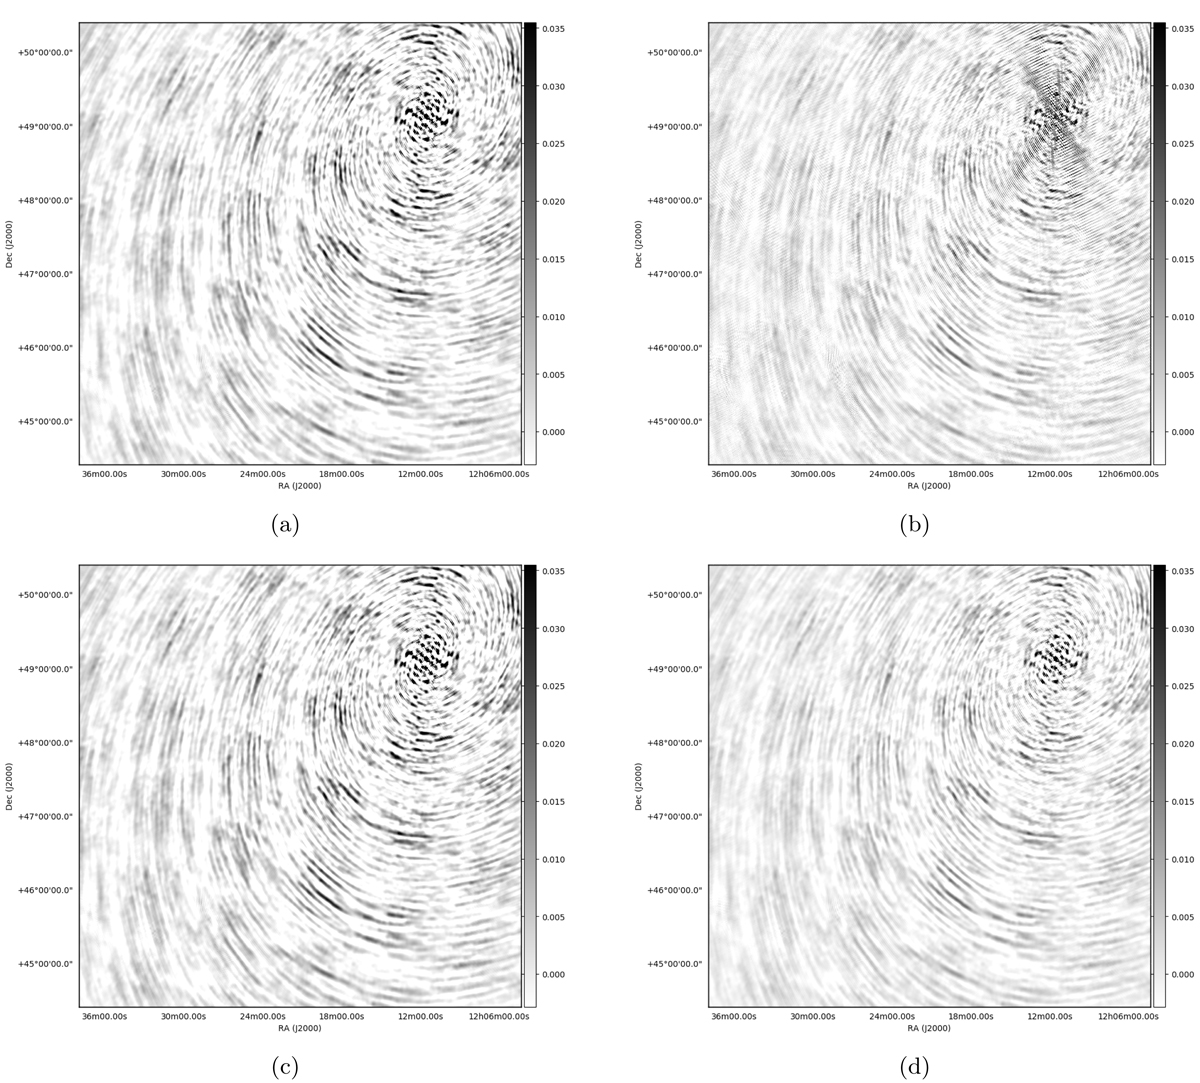
Dirty maps of a single point source simulated into the visibilities. The images on the left are made using the simulated visibilities directly. The images on the right are made using the superstation visibilities: at the top they are simulated directly, and at the bottom they result from post-processing beamforming. The higher spatial frequencies are suppressed: this accounts for the absence of the x-shaped artefact in panel d: this artefact is in fact the part of the PSF that corresponds to our high spatial frequencies. The peak flux values are: 1.77 Jy in panel a, 1.77 Jy in panel b, 1.74 Jy in panel c, and 1.09 Jy in panel d.
Current usage metrics show cumulative count of Article Views (full-text article views including HTML views, PDF and ePub downloads, according to the available data) and Abstracts Views on Vision4Press platform.
Data correspond to usage on the plateform after 2015. The current usage metrics is available 48-96 hours after online publication and is updated daily on week days.
Initial download of the metrics may take a while.