| Issue |
A&A
Volume 637, May 2020
|
|
|---|---|---|
| Article Number | A37 | |
| Number of page(s) | 13 | |
| Section | Atomic, molecular, and nuclear data | |
| DOI | https://doi.org/10.1051/0004-6361/202037453 | |
| Published online | 08 May 2020 | |
Photodissociation branching ratios of 13C16O and 12C18O in the vacuum ultraviolet region from 107 800 to 109 700 cm−1
1
Beijing National Laboratory for Molecular Sciences (BNLMS), Institute of Chemistry, Chinese Academy of Sciences, Beijing 100190, PR China
e-mail: This email address is being protected from spambots. You need JavaScript enabled to view it.
; This email address is being protected from spambots. You need JavaScript enabled to view it.
2
University of Chinese Academy of Sciences, Beijing, 100049, PR China
Received:
7
January
2020
Accepted:
21
March
2020
Abstract
In this study, we present C+ ion photofragment spectroscopic studies and photodissociation branching ratio measurements for two CO isotopologs, 13C16O and 12C18O, in the vacuum ultraviolet (VUV) region from 107 800 cm−1 (92.76 nm) to 109 700 cm−1 (91.16 nm) using a time-slice velocity-map imaging setup and a tunable VUV laser radiation source generated by the two-photon resonance-enhanced four-wave mixing technique. Several absorption bands of 12C16O in the above energy region are reinvestigated up to higher rotational levels compared with previous studies. The results are compared among 12C16O, 13C16O, and 12C18O on a state-by-state basis, and the photodissociation branching ratios for channels C(1D) + O(3P), and C(3P) + O(1D) are dramatically changed for most of the absorption bands due to the substitutions of 12C by 13C and 16O by 18O. The branching ratios of 13C16O and 12C18O are close to each other due to their similar reduced masses. The strong and selective isotope effects obtained here not only provide useful information for understanding the complicated predissociation dynamics of CO, but are also important for developing a comprehensive photochemical model for explaining the C and O isotope heterogeneities as observed in the Solar System.
Key words: astrochemistry / molecular data / Sun: UV radiation / ISM: molecules / ISM: kinematics and dynamics / photon-dominated region
© ESO 2020
1. Introduction
Carbon monoxide (CO) is the second most abundant molecular species in the interstellar medium after hydrogen (H2) and one of the most studied molecules in the fields of astronomy and astrophysics (Bally & Langer 1982; van Dishoeck & Black 1988; Yan et al. 2000; Bertoldi et al. 2003). An intriguing model known as CO “self-shielding” has been proposed for interpreting the abnormal oxygen isotopic compositions as observed in the early Solar System materials (Clayton 2002; Yurimoto & Kuramoto 2004; Lyons & Young 2005). Early self-shielding models only considered the “shielding” effect caused by the isotope dependent absorption peak positions and the large difference of column densities between 12C16O and other rare CO isotopologs.
However, other important photochemical properties, such as oscillator strengths and predissociation rates, were not considered to be isotope dependent in the early models. Recently, Chakraborty et al. (2008) measured the oxygen isotopic fractionation associated with CO photodissociation at different VUV wavelengths and in different experimental conditions. These latter authors found that the abundance ratios between 17O and 18O are strongly wavelength dependent with various values other than 1, which is thought to be contrary to early self-shielding models. This conclusion was immediately questioned by several other researchers (Federman & Young 2009; Lyons et al. 2009; Yin et al. 2009). Visser et al. (2009) updated the early model of van Dishoeck & Black (1988) using new accurate spectroscopic data from the literature, and concluded that CO “self-shielding” is very important, while other isotope-dependent properties besides the absorption line positions need to be taken into account. The anomalous O isotope distributions observed in the Solar System are believed to be mainly caused by the CO self-shielding effect, while other important isotope-dependent photolysis properties of CO also play important roles, such as photo-absorption cross sections, oscillator strengths, and predissociation rates.
Whole spectroscopic studies have been devoted to characterizing the molecular parameters of all CO isotopologs so that the astronomical observations can be better interpreted and to further improve the photochemical modeling (Eidelsberg & Rostas 1990; Eidelsberg et al. 1991, 1992, 2004, 2006, 2012, 2014, 2017; Eikema et al. 1994; Ubachs et al. 1994; Stark et al. 2014; Lemaire et al. 2018), but very few studies have discussed the subsequent “trapping reactions” following the VUV photodestruction process of CO (Clayton 2011; Shi et al. 2017; Lyons et al. 2018). Recently, Lyons et al. (2018) reanalyzed the ATMOS FTS data and found that the heavy C isotope (13C) is also depleted in the Sun compared with that in the Earth and other planetary objects. These latter authors considered a variety of reactions and estimated the chemical loss timescales of the most relevant species to evaluate the possible chemical pathways for several carbon species in the solar nebula. In their model, the reaction between excited C(1D) atoms and H2 is several orders of magnitude faster than any other reaction, which may play an important role in sequestering the isotope fractionation results formed in the photodissociation process. To quantitatively verify the roles played by the excited C(1D) and O(1D) atoms, accurate determination of the branching ratios in the photodissociation processes of all CO isotopologs is highly desired.
Since 2011, significant progress has been made toward systematically determining the quantum state populations of the atomic photodissociation products of 12C16O and its isotopologs using a time-slice velocity-map imaging (TSVMI) setup and a tunable VUV laser radiation source produced by the two-photon resonance-enhanced four-wave mixing scheme. Jackson, Ng, Gao, and coworkers (Gao et al. 2011, 2012, 2013; Shi et al. 2018; Jiang et al. 2019a; Chi et al. 2020a) measured and documented all strong 12C16O absorption bands in the VUV region from 102 807 cm−1 (97.27 nm) to 109 700 cm−1 (91.16 nm) that are of astrophysical importance as listed in Table 1 by Visser et al. (2009). Collectively, these findings show that the photodissociation products are formed not only in the ground state, but also in the excited states in substantial amounts. The photodissociation branching ratios are strongly quantum-state dependent. Recently, Gao and coworkers (Jiang et al. 2019b, 2020; Chi et al. 2020b) measured the photodissociation branching ratios of 13C16O in the VUV region from 102 807 cm−1 (97.27 nm) to 107 685 cm−1 (92.87 nm), which are found to be dramatically different from those of 12C16O. This strong and selective isotope effect on the photodissociation branching ratio is important for future quantitative photochemical modeling.
In the present work, we continue to measure the photodissociation branching ratios of 13C16O in the higher energy range from 107 800 cm−1 (92.76 nm) to 109 700 cm−1 (91.16 nm) with the same experimental method, and those of 12C18O are also measured for the first time in the same energy range. To compare with 13C16O and 12C18O, several absorption bands of 12C16O in the titled energy region are reinvestigated up to higher rotational levels. The C+ ion photofragment spectra and the corresponding photodissociation branching ratios of 13C16O and 12C18O are similar to each other due to their similar reduced masses, while both of them are dramatically different from that of 12C16O. This is important not only for any relevant astrophysical applications, but also for understanding the complicated predissociation dynamics of CO.
2. Experimental method
The experimental setup and the data-collection procedure used in the current study have been described in detail before, which consists of a TSVMI component and a tunable VUV laser radiation source (Qi et al. 2018; Jiang et al. 2019a,b). Briefly, a pulsed supersonic molecular beam of different pure CO isotopologs (Yuan-Hua in China, 12C16O > 99.9%; Cambridge Isotope, 13C16O, 13C = 99%, 18O < 5%; Linde Gas North America LLC, 13C16O, 13C > 99%, 18O < 5%; Sigma-Aldrich, 12C18O > 95%, 18O > 99%) is generated by a general valve (Parker, Series 9) with a nozzle diameter of 0.5 mm operating at the stagnation pressure of 30 psi and repetition rate of 10 Hz. The molecular beam passes through two conical skimmers (both with diameter of 2 mm) and perpendicularly intersects with the tunable VUV beam in the photodissociation/photoionization (PD/PI) region of the TSVMI setup. CO molecules absorb a single sum-frequency VUV photon to be excited to specific quantum states, and then undergo predissociation to form C and O atoms in the 3P and 1D states. The nascent C atoms thus produced are directly photoionized by absorbing a second sum-frequency VUV photon in the same laser pulse. The C+ ions are extracted and focused by the VMI ion optics onto a microchannel plate (MCP) detector. The electrons ejected from the MCP detector by ion impact are accelerated onto a phosphor screen to form an image that is recorded by a CCD camera.
The tunable VUV laser radiation used in the current study is produced by the two-photon resonance-enhanced four-wave mixing scheme with the pulsed Xe gas as the nonlinear medium. The third harmonic output of a Nd:YAG laser (Quanta-Ray, Pro-270-10E) operating at 10 Hz is used to pump two dye lasers (Sirah, Cobra-Stretch) at the same time. The first dye laser is frequency doubled to generate UV laser (ω1), which is fixed at 222.568 nm to be resonant with the two-photon transition of Xe: (5p)5(2P1/2)6p2[1/2](J=0) ← (5p)61S0 at 89 860.015 cm−1. The second dye laser is used to generate the visible laser beam (ω2), which is tuned from 504 to 557 nm. The UV (ω1) and visible (ω2) laser beams are combined through a dichroic mirror, and then focused into a T-shape channel by two plano-convex lenses both with f = 600 mm. The Xe gas is pulsed into the T-shape channel by a second general valve (Parker, Series 9) when the two laser beams arrive. A four-wave mixing process occurs in the T-shape channel for generating the tunable sum-frequency VUV laser radiation (2ω1+ω2) from 107 800 cm−1 to 109 700 cm−1 as used in the current experiment. The difference-frequency VUV (2ω1–ω2) is also generated and enters the PD/PI region together with the UV (ω1), visible (ω2), and sum-frequency VUV (2ω1+ω2) laser beams.
In this study, we gate and integrate on the C+ ion peak in the time-of-flight (TOF) mass spectra while scanning the VUV photon energy from 107 800 cm−1 to 109 700 cm−1 to acquire the C+ ion photofragment spectra, which help us identify the vibronic states and rotational levels of 13C16O and 12C18O that are being studied. The VUV photon energy is then fixed at a specific rovibronic level and the corresponding TSVMI image is collected. The three dissociation channels C(3P) + O(3P), C(1D) + O(3P) and C(3P) + O(1D) can be distinguished in the TSVMI images by their different kinetic energy releases. The branching ratios into the three channels can be deduced by integrating the corresponding peaks in the total kinetic energy release (TKER) spectra converted from the TSVMI images after normalization with respect to the photoionization cross sections of C(3P) and C(1D), respectively. In this study, the photodissociation branching ratios (or percentages) for channels C(3P) + O(3P), C(1D) + O(3P) and C(3P) + O(1D) are defined as [C(3P) + O(3P)]/{[C(3P) + O(3P)] + [C(1D) + O(3P)] + [C(3P) + O(1D)]}×100%, [C(1D) + O(3P)]/ {[C(3P) + O(3P)] + [C(1D) + O(3P)] + [C(3P) + O(1D)]}×100% and [C(3P) + O(1D)]/{[C(3P) + O(3P)] + [C(1D) + O(3P)] + [C(3P) + O(1D)]}×100%, respectively, where the square brackets represent the photoionization cross section corrected peak intensities of the corresponding photodissociation channels in the TKER spectra.
3. Results and discussion
The C+ ion photofragment spectra produced from the predissociation of 13C16O and 12C18O in the VUV photon energy region from 107 800 cm−1 (92.76 nm) to 109 700 cm−1 (91.16 nm) are shown in Figs. 1–4. The assignments of peak positions and rotational quantum levels are based on the previous spectroscopic studies by Eidelsberg & Rostas (1990), Eidelsberg et al. (1991, 2004) and Casey (1978). Total kinetic energy release (TKER) spectra are converted from the time-slice velocity-map ion (TSVMI) images and the kinetic energies of each peak in TKER spectra are used to distinguish the three lowest dissociation channels, namely C(3P) + O(3P), C(1D) + O(3P), and C(3P) + O(1D). The branching ratios into the three dissociation channels are deduced by integrating the corresponding peaks in the TKER spectra after normalization with respect to the photoionization cross sections of C(3P) and C(1D), respectively. The photoionization cross section of C(3P) was measured to be ∼16 Mb with an uncertainty of ∼30% in the above-mentioned energy region (Cantu et al. 1981). The photoionization cross section of C(1D) was calculated by Burke & Taylor (1979). Its value increases abruptly from ∼25 Mb at ∼95 nm to ∼65 Mb at ∼90 nm under the dipole length CI approximation; while under a different approximation, it increases from ∼24 Mb at ∼95 nm to ∼50 Mb at ∼90 nm (see Fig. 4 in Burke & Taylor 1979). This implies a relatively large uncertainty on the photoionization cross section of C(1D). Furthermore, the previously reported data were presented in the form of figures in large energy scales, which made it hard to obtain accurate cross section values in a wavenumber-resolved level as is needed in the current study. Thus, the photoionization cross sections used in the current study have large uncertainties. Tables 1 and 2 list the photoionization cross section values that we use for all the absorption bands here; these can be used to correct the branching ratio values easily in case higher accuracy photoionization cross sections of C(1D) and C(3P) become available in the future. Fortunately, the large uncertainty of the photoionization cross section does not dramatically affect the comparisons among different absorption bands and different CO isotopologs as presented in the following sections.
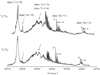 |
Fig. 1. C+ ion photofragment spectra of 13C16O (top) and 12C18O (bottom) in the VUV photon energy region from 109 100 cm−1 to 109 700 cm−1, which include the following vibronic states: (6pσ) 1Σ+(v′ = 0), (6pπ) 1Π(v′ = 0), (4pσ) 1Σ+(v′ = 3), (4sσ) 1Σ+(v′ = 4), (5pπ) 1Π(v′ = 1), and (4pπ) 1Π(v′ = 3). The relative intensities of the spectra are not normalized according to the corresponding VUV intensities. Red arrows: (6pπ) 1Π(v′ = 0); blue arrows: (4pσ) 1Σ+(v′ = 3) and (4sσ) 1Σ+(v′ = 4). |
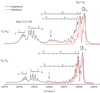 |
Fig. 2. C+ ion photofragment spectra of 13C16O (top) and 12C18O (bottom) in the VUV photon energy region from 108 750 cm−1 to 108 942 cm−1, which include vibronic states: (6sσ) 1Σ+(v′ = 0), 1Π(v′ = 2) and an unknown underlying continuum as described in Sect. 3.3. The relative intensities of the spectra are not normalized according to the corresponding VUV intensities. Black: experimental spectra; red: simulated spectra by the PGOPHER program (Western 2017); blue arrows: broad underlying continuum. |
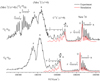 |
Fig. 3. C+ ion photofragment spectra of 13C16O (top) and 12C18O (bottom) in the VUV photon energy region from 108 270 cm−1 to 108 510 cm−1, which include vibronic states: (5dσ) 1Σ+(v′ = 0), C′1Σ+(v′ = 9), a newly observed 1Π state of 13C16O and 12C18O, and the (5dσ) 1Σ+(v′ = 0) state of 13C18O (see Sect. 3.7 for detail). The relative intensities of the spectra are not normalized according to the corresponding VUV intensities. Black: Experimental spectra. Red: simulated spectra by the PGOPHER program (Western 2017). |
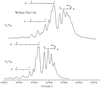 |
Fig. 4. C+ ion photofragment spectra of the W(3sσ) 1Π(v′ = 3) state for 13C16O (top) and 12C18O (bottom). The relative intensities of the spectra are not normalized according to the corresponding VUV intensities. |
Photodissociation branching ratios of the channels C(3P) + O(1D), C(1D) + O(3P), and C(3P) + O(3P) for 13C16O in the region from 107 800 to 109 700 cm−1 (91.16–92.76 nm).
Photodissociation branching ratios of the channels C(3P) + O(1D), C(1D) + O(3P), and C(3P) + O(3P) for 12C18O in the region from 107 800–109 700 cm−1 (91.16–92.76 nm).
Using the method described above, we measured the branching ratio at each of the VUV photon energy positions at least three times on different days. The averaged branching ratio values of 13C16O and 12C18O are listed in Tables 1 and 2, respectively. The error bars presented in Tables 1 and 2 are simply the standard deviations (1σ) of the three independent measurements, which do not take any possible systematic uncertainties into account. The systematic uncertainty from the present experimental setup was estimated to be ∼5% (Chi et al. 2020b), which is probably due to the presence of tripling VUV (3ω1) in the interaction region, slightly different slicing durations on the MCP, nonuniform efficiency across the whole active area of the MCP detector, and so on. Typical TSVMI images of 12C16O, 13C16O, and 12C18O, and the corresponding TKER spectra are presented for absorption bands of C′1Σ+(v′ = 9) and 1Π(v′ = 2) in Fig. 5 for direct comparisons. Figure 5 shows immediately that the substitution of 12C for 13C or 16O for 18O can greatly alter the photodissociation branching ratios of CO; while those for 13C16O and 12C18O are close to each other, which is to be expected due to their similar reduced masses. In the following, we present the detailed analysis of the C+ ion photofragment spectra and the branching ratio values on a state-by-state basis for 13C16O and 12C18O, with special attention given to their comparisons with 12C16O. This provides valuable information for understanding the complicated predissociation dynamics of CO and expanding its applications in astronomy. For comparison, the relevant photodissociation branching ratios of 12C16O reproduced from previous studies are provided in Appendix A.
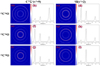 |
Fig. 5. Comparison of TSVMI images and the corresponding TKER spectra among 12C16O, 13C16O and 12C18O for two absorption bands: R(0) line of the C′1Σ+(v′ = 9) state ((a), (b), (e), (f), (i), (j)) and R(0) line of the 1Π(v′ = 2) state ((c), (d), (g), (h), (k), (l)). The heights of the three peaks in the TKER spectra are rescaled by setting the highest peak in each spectrum to 1. |
3.1. 109 220–109 700 cm−1 (Fig. 1)
The photoabsorption and photoionization spectra of the main isotopolog 12C16O in the energy region from 109 200 cm−1 to 109 650 cm−1 have previously been presented and analyzed by Rostas et al. (1994), Huber (1997), and Eidelsberg et al. (2004). According to these spectroscopic studies, five mutually interacting vibronic states of CO, namely (5pσ) 1Σ+(v′ = 1), (4sσ) 1Σ+(v′ = 4), (4pσ) 1Σ+(v′ = 3), (5pπ) 1Π(v′ = 1), and (4pπ) 1Π(v′ = 3) are located in this small energy region. These states were believed to predissociate through strong interactions with the well-known D′ 1Σ+ state, which correlates to the lowest dissociation channel C(3P) + O(3P). The recent photodissociation branching ratio measurements of 12C16O in this energy region (Gao et al. 2011, 2012) showed that all the states mentioned above (except for (5pσ) 1Σ+(v′ = 1), which was not observed) dissociate not only into the lowest channel C(3P) + O(3P) but also into the two spin-forbidden channels C(1D) + O(3P) and C(3P) + O(1D) in substantial amounts. In this study, we measure the C+ ion photofragment spectra and the corresponding branching ratios in this region for 13C16O and 12C18O, which are found to be dramatically different from those of 12C16O, showing strong isotope effect. As shown in Fig. 1, the shapes of the C+ ion photofragment spectra are almost the same as those of the absorption spectra as previously presented by Huber (1997) except for the cluster of peaks at ∼109 380 cm−1. These latter peaks are due to transitions from the ground vibronic state to the A1Π (v′ = 4) state of 13C16O or 12C18O by absorbing the difference-frequency VUV at ∼70340 cm−1 (Gavilan et al. 2013), which is also present in the PD/PI region as described in Sect. 2.
3.1.1. (4sσ) 1Σ+(v′ = 4) & (4pσ) 1Σ+(v′ = 3) (Figs. 1, 6)
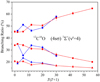 |
Fig. 6. Dependence of the photodissociation branching ratio into the three lowest dissociation channels C(3P) + O(3P), C(1D) + O(3P), and C(3P) + O(1D) on J′(J′+1) for the (4sσ) 1Σ+(v′ = 4) state of 12C16O, where J′ is the rotational quantum number of the upper level. The error bars represent the standard deviations (1σ) of three independent measurements. Square: C(3P) + O(3P); dot: C(1D) + O(3P); triangle: C(3P) + O(1D). Blue: R-branch. Red: P-branch. |
We remeasured the branching ratios of the (4sσ) 1Σ+(v′ = 4) state for 12C16O up to much higher rotational levels and the dependence on the rotational quantum number J′ is presented in Fig. 6. At low J′ levels, the branching ratio values are consistent with the previous measurements within the experimental uncertainties (Gao et al. 2011). The discrepancy between the R- and P-branches at several J′ levels can be explained by overlap with the nearby (4pσ) 1Σ+(v′ = 3) state. As shown in Fig. 6, the percentages into the channel C(3P) + O(3P) increase linearly as a function of J′(J′+1), and those into the spin-forbidden channels C(1D) + O(3P) and C(3P) + O(1D) decrease accordingly. Similar rotational dependence of the branching ratio in this region was also observed in the recent study by the two-color VUV-VUV laser pump-probe time-slice velocity-map ion imaging method (Gao et al. 2020). This observation cannot be explained solely through interactions with the valence D′ 1Σ+ state. It seems to be consistent with the spectroscopic analyses by Huber (1997) and Eidelsberg et al. (2004) that a dark 1Π perturber state must be present in this region, which might be responsible for the strong dissociation into the spin-forbidden channels and its dependence on the rotational quantum number as described above.
As compared with 12C16O, the photoabsorption peak positions of the (4sσ) 1Σ+(v′ = 4) and (4pσ) 1Σ+(v′ = 3) states for 13C16O and 12C18O are red shifted by ∼150 cm−1, and the shape of the spectra transforms from highly rotationally resolved structure in the case of 12C16O into totally diffuse structure as indicated by the three broad peaks at ∼109 300 cm−1 as shown in Fig. 1. The photodissociation branching ratios at the three diffuse peaks are measured for 13C16O and 12C18O, as listed in Tables 1 and 2, respectively. The (4sσ) 1Σ+(v′ = 4) and (4pσ) 1Σ+(v′ = 3) states of 13C16O and 12C18O almost completely dissociate into the ground channel C(3P) + O(3P); while in the case of 12C16O, substantial percentages of the dissociation products are formed through the spin-forbidden channels C(1D) + O(3P) and C(3P) + O(1D) (Gao et al. 2011, 2012). This implies that the valence D′ 1Σ+ state has become the dominant perturber state in this region for 13C16O and 12C18O, and the interaction with the dark 1Π state as identified by Huber (1997) and Eidelsberg et al. (2004) for 12C16O becomes negligibly weak. This is also consistent with the observations for the (5pπ) 1Π(v′ = 1) and (4pπ) 1Π(v′ = 3) states as described below.
3.1.2. (5pπ) 1Π(v′ = 1) (Fig. 1)
The (5pπ) 1Π(v′ = 1) state is buried in the two strong absorption bands of (4sσ) 1Σ+(v′ = 4) and (4pσ) 1Σ+(v′ = 3) for 12C16O, and was not observed in either our previous studies (Gao et al. 2011, 2012) or the current study. In the cases of 13C16O and 12C18O, the above two strong absorption bands shift away, and a highly rotationally resolved 1Π band shows up at ∼109 440 cm−1 as shown in Fig. 1, whose upper state is tentatively assigned as (5pπ) 1Π(v′ = 1). Its C+ ion photofragment spectra can be well reproduced using the spectrum simulation program PGOPHER (Western 2017) (not shown in Fig. 1); the band origin and rotational constant determined in this way are listed and compared to those of Eidelsberg et al. (1991) in Table 3. The (5pπ) 1Π(v′ = 1) state has very narrow rotational transitions implying rather long predissociation lifetimes, which is in marked contrast to the (4sσ) 1Σ+(v′ = 4) and (4pσ) 1Σ+(v′ = 3) states. This is consistent with the above observation that interaction with the D′ 1Σ+ state is the dominant predissociation pathway for 13C16O and 12C18O in this region, and direct 1Σ+–1Σ+ interaction is usually much stronger than the 1Π–1Σ+ interaction. The photodissociation branching ratios of this state are measured and listed in Tables 1 and 2 for 13C16O and 12C18O, respectively. For 13C16O, the percentages into channels of producing C(1D) and O(1D) atoms are <1% and ∼10%, respectively; while for 12C18O, the percentages into both of the two spin-forbidden channels are <5%. A weak dependence on the rotation and parity seems to be observable, but cannot be confirmed in the current condition due to the weak signal level.
Band origins and rotational constants for several vibronic states as determined in the present study by the PGOPHER program (Western 2017).
3.1.3. (4pπ) 1Π(v′ = 3) (Fig. 1)
The C+ ion photofragment spectra of the (4pπ) 1Π(v′ = 3) state for 13C16O and 12C18O are observed at ∼109 600 cm−1 with partially resolved rotational structures as shown in Fig. 1. The spectra can be well reproduced using the spectrum simulation program PGOPHER (Western 2017) (not shown in Fig. 1); the band origin and rotational constant determined in this way are listed and compared to those of Eidelsberg et al. (1991) in Table 3. Here, the branching ratios of 13C16O and 12C18O are measured only at the strong Q-branches, and the percentages into the two spin-forbidden channels C(1D) + O(3P) and C(3P) + O(1D) are both <5% as listed in Tables 1 and 2. These are much smaller compared with those of 12C16O, for which ∼22% and ∼30% dissociates into the channels C(1D) + O(3P) and C(3P) + O(1D), respectively at this state as observed by Gao et al. (2012).
As compared with 12C16O, two facts can be summarized for 13C16O and 12C18O in the energy region from 109 220 cm−1 to 109 700 cm−1: the two 1Σ+ states ((4sσ) 1Σ+(v′ = 4) and (4pσ) 1Σ+(v′ = 3)) are totally diffuse and the two 1Π states ((5pπ) 1Π(v′ = 1) and (4pπ) 1Π(v′ = 3)) show rotational resolved structures; all the four observed states in this region predominantly dissociate into the ground channel C(3P) + O(3P). These two facts imply that interactions with the D′ 1Σ+ state might dominate the predissociation processes of 13C16O and 12C18O in this energy region, and the interaction with the dark 1Π perturber state as identified in the case of 12C16O should have become much weaker for the two rare isotopologs.
3.2. (6pσ) 1Σ+(v′ = 0) & (6pπ) 1Π(v′ = 0) (Fig. 1)
The (6pσ) 1Σ+(v′ = 0) and (6pπ) 1Π(v′ = 0) states of 12C16O were presented in the jet absorption spectra (Huber 1997), while only the (6pσ) 1Σ+(v′ = 0) state was observed in photoionization measurements (Eikema et al. 1994; Ubachs et al. 1994). The C+ ion photofragment spectra of these two states for 12C16O were obtained recently in our lab (Gao et al. 2012; Chi et al. 2020a) and are similar in shape to the jet absorption spectra as obtained by (Huber 1997). In this study, we collect the C+ ion photofragment spectra of these two states for 13C16O and 12C18O, which are shown in Fig. 1. It can be seen that the substitution of 12C by 13C transforms the highly rotationally resolved structure of the (6pσ) 1Σ+(v′ = 0) state for 12C16O into totally diffuse structure for 13C16O . This is consistent with the jet absorption study by Huber (1997). The C+ ion photofragment spectra of 12C18O are similar to that of 13C16O, while the (6pπ) 1Π(v′ = 0) state can barely be seen in the spectra of 12C18O. The branching ratios measured for these two states are listed in Tables 1 and 2, with the (6pπ) 1Π(v′ = 0) state of 12C18O not measured due to its rather weak signal level. Dissociation into the ground channel C(3P) + O(3P) dominates the predissociation processes of these two states for both 13C16O and 12C18O, and the percentages into the two spin-forbidden channels are all <5%. It is also the case for 12C16O that the channels producing C and O atoms in the excited states are ∼2% and ∼3% respectively as observed before (Gao et al. 2012; Chi et al. 2020a). Thus, the predissociation of these two Rydberg states should mainly be caused by the D′ 1Σ+ state.
3.3. 1Π(v′ = 2) (Figs. 2, 7)
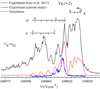 |
Fig. 7. C+ ion photofragment spectra of the 1Π(v′ = 2) state for 12C16O. The relative intensities of the spectra are not normalized according to the corresponding VUV intensities. Black: experimental spectrum obtained in the current study. Red: simulated spectrum by the PGOPHER program (Western 2017). Blue: experimental spectrum obtained by Gao et al. (2011). |
The C+ ion photofragment spectra of this state for 13C16O and 12C18O are obtained as shown in Fig. 2. We employ the spectrum simulation program PGOPHER (Western 2017) to simulate the spectra, which are shown as red in Fig. 2. The band origins and rotational constants determined by the simulation are listed in Table 3, which agree well with the previous spectroscopic study by Eidelsberg et al. (1991). As shown in Fig. 2, the simulated spectra accurately reproduce the peak positions and also reproduce the relative intensities reasonably well at low J′ levels. At the VUV photon energy corresponding to high J′ levels in Q- and P-branches, which is close to the (6sσ) 1Σ+(v′ = 0) state, a broad underlying continuum can be clearly seen in the spectra of both 13C16O and 12C18O taking into account the fact that the VUV intensity here does not show peak structures. In order to perform a more detailed analysis, we reinvestigated the 1Π(v′ = 2) state of 12C16O in this study and its C+ ion photofragment spectrum is shown in Fig. 7. This latter is dramatically different from the spectrum obtained in the previous study by Gao et al. (2011), where only the Q branch was observed, as shown by the blue spectrum in Fig. 7. This might be due to the different molecular beam temperatures generated by the Even-Lavie valve and the general valve (Jiang et al. 2019a). The simulated spectrum generated using PGOPHER is presented in red in Fig. 7 for comparison with the experimental one. The band origin and rotational constant used in the simulation are listed in Table 3, which are close to that obtained in the previous spectroscopic study by Eidelsberg et al. (1991). As seen in Fig. 7, the R-branch and the low J′ levels in Q-branch are reproduced reasonably well by the simulation, while the P-branch and the high J′ levels in Q-branch dramatically deviate from the simulation; in particular, the broad peak structure at ∼109 002 cm−1 cannot be seen from the simulation. This implies the existence of a new broad absorption band overlapping with the 1Π(v′ = 2) state, which corresponds to the broad underlying continua as observed in 13C16O and 12C18O described above.
The existence of the new state is also evident from the branching ratio measurements. The branching ratios of the 1Π(v′ = 2) state for 12C16O measured in the current study are listed in Table 4. The values for the low J′ levels in Q-branch are consistent with the previous study within the experimental uncertainty (Gao et al. 2011), and are equal to those of R-branch, which are observed to be independent of the rotational quantum number as shown in Table 4. The branching ratios for 13C16O and 12C18O are also observed to be independent of both the parity and rotation as listed in Tables 1 and 2, respectively. However, the branching ratios of 12C16O measured at the broad peak structure at ∼109 002 cm−1 in Fig. 7 are dramatically different from those for R-branch and the low J′ levels in Q-branch as listed in Table 4. This again implies that the broad peak structure at ∼109 002 cm−1 should originate from a different vibronic state of CO. This new state dissociates with much smaller relative percentages into the C(3P) + O(1D) channel compared with the 1Π(v′ = 2) state in the case of 12C16O; it shifts away from the 1Π(v′ = 2) state in 13C16O and 12C18O as shown in Fig. 2. Accurate photoabsorption studies are needed to fully characterize this new state.
Photodissociation branching ratios into the channels C(3P) + O(1D), C(1D) + O(3P), and C(3P) + O(3P) for the 1Π(v′ = 2) state of 12C16O at 109 019.4 cm−1.
Despite the fact that the branching ratios for the three CO isotopologs studied here are all independent of the parity and rotation, a strong isotope effect can be seen in the absolute values. The branching ratios of 13C16O and 12C18O are only slightly different from each other as expected, while they are both dramatically different from that of 12C16O. For 13C16O and 12C18O, the percentages into the channels C(1D) + O(3P) and C(3P) + O(1D) are ∼40% and ∼10%, respectively; while for 12C16O, the percentages are ∼20% and ∼50%, respectively. This strong isotope effect implies complicated predissociation dynamics of CO in this highly excited region.
3.4. (6sσ) 1Σ+(v′ = 0) (Fig. 2)
The (6sσ) 1Σ+(v′ = 0) state of 12C16O was observed in the absorption spectra (Eidelsberg & Rostas 1990) and in the triple resonant ion-dip spectra (Komatsu et al. 1995), but it was not observed in any photoionization studies before due to its fast predissociation process (Eikema et al. 1994; Ubachs et al. 1994). Its C+ ion photofragment spectrum and branching ratios were reported for the first time in our recent study, and no excited atomic products could be detected (Chi et al. 2020a). In the current study, the C+ ion photofragment spectra of 13C16O and 12C18O are collected and shown in Fig. 2. Weak but detectable signal into the two spin-forbidden channels C(1D) + O(3P) and C(3P) + O(1D) can be observed for both 13C16O and 12C18O. The measured values are listed in Tables 1 and 2, respectively. A weak dependence of the branching ratios on rotation seems to be observable, but cannot be confirmed with the detection sensitivity of the current setup.
3.5. New 1Π state (Fig. 3)
In our recent studies of 12C16O, a weak absorption band of 1Π characters at ∼108 500 cm−1 was identified, and substantial percentages of dissociation into the spin-forbidden channels were observed (Gao et al. 2020; Chi et al. 2020a). Here, this new 1Π band is also observed for 13C16O and 12C18O in the C+ ion photofragment spectra as shown in Fig. 3, which is shifted to ∼108 460 cm−1. The spectra can be accurately simulated by PGOPHER using the band origins and rotational constants listed in Table 3. The simulated spectra are presented as red in Fig. 3. The branching ratios of Q- and R-branches for 13C16O and 12C18O are measured and listed in Tables 1 and 2, respectively. The photodissociation branching ratios of 13C16O and 12C18O are close to each other at this state and are slightly different from that of 12C16O (Chi et al. 2020a). Despite the different branching ratios, the three CO isotopologs show very similar dissociation properties at this state, that is, the branching ratios are parity dependent, and the percentages into the spin-forbidden channels measured in R-branch decrease linearly as a function of J′(J′+1). This indicates that a heterogeneous interaction with a repulsive 1Σ+ state correlating to the ground channel C(3P) + O(3P) must play a role in the predissociation process. Besides the rotation-dependent photodissociation, we also see photodissociation that is independent of both rotation and parity, which implies that homogeneous interaction with a 1Π state is also involved in the predissociation process of this state. Similar phenomena have been observed previously for many 1Π states of CO (Gao et al. 2013; Jiang et al. 2019a, 2020; Chi et al. 2020b).
3.6. C′1Σ+(v′ = 9) (Fig. 3)
The C+ ion photofragment spectra of the C′1Σ+(v′ = 9) state show partially resolved rotational structures as shown in Fig. 3 for 13C16O and 12C18O, which are in contrast to the totally diffuse structure for 12C16O at this state as observed recently by Chi et al. (2020a). The C+ ion photofragment spectra are well simulated by PGOPHER using the band origins and rotational constants listed in Table 3. The R-bandhead positions agree well with the previous observations by Eidelsberg et al. (2004). As recently measured by Chi et al. (2020a), the percentages into the two spin-forbidden channels C(1D) + O(3P) and C(3P) + O(1D) are ∼6% and ∼9%, respectively for 12C16O. While for 13C16O and 12C18O, the percentages into the spin-forbidden channels are much larger as listed in Tables 1 and 2. For 13C16O, the relative ratios into the two spin-forbidden channels C(1D) + O(3P) and C(3P) + O(1D) are ∼12% and ∼50%, respectively; for 12C18O, the percentages are ∼12% and ∼60% respectively. A similar strong isotope effect was also observed for the C′1Σ+(v′ = 7) state recently (Jiang et al. 2019b). The percentages slightly decrease with increasing J′ levels, which might be caused by partial overlapping with the nearby (5dσ) 1Σ+(v′ = 0) state. As proposed before (Eidelsberg et al. 2004; Chi et al. 2020a), the highly vibrational excited levels of the valence C′1Σ+ state, for example C′1Σ+(v′ = 9), reach into the Franck-Condon-permitted region through interaction with the high vibrational levels of mixed B(3sσ)1Σ+-D′ 1Σ+ character which dissociates into the ground channel (Eidelsberg et al. 2004), and also through the interaction with nearby Rydberg states of 1Π character, which dissociate into the spin-forbidden channels through spin-orbit 1Π–3Π couplings (Chi et al. 2020a). The relative branching ratios into the ground channel and the two spin-forbidden channels are determined by the competition between the two interactions mentioned above. If the interacting Rydberg 1Π state is assumed to be the newly observed 1Π state as described in Sect. 3.5, the mutual interactions between the C′1Σ+(v′ = 9) state and the new 1Π state might be closely equal to each other for 12C16O, 13C16O, and 12C18O by considering the fact that these two states are almost equally separated from each other in the potential energy surfaces of the three CO isotopologs as shown in the C+ ion photofragment spectra. This indicates that the smaller percentages into the two spin-forbidden channels observed for 12C16O (Chi et al. 2020a) are probably due to a stronger interaction between the C′1Σ+(v′ = 9) state and the high vibrational states of mixed B(3sσ)1Σ+–D′ 1Σ+ character. This is also consistent with the observation that the C′1Σ+(v′ = 9) state of 12C16O has a faster predissociation rate than those of 13C16O and 12C18O, which causes its spectrum to appear totally diffuse (Chi et al. 2020a). while the C′1Σ+(v′ = 9) state of 13C16O and 12C18O show partially resolved rotational structures, as shown in Fig. 3. The tentative picture described here could be oversimplified; accurate ab initio calculation of the potential energy curves and their mutual interactions is needed to fully understand the complicated predissociation dynamics in this highly excited region.
3.7. (5dσ) 1Σ+(v′ = 0) (Fig. 3)
The (5dσ) 1Σ+(v′ = 0)) state of 12C16O was reported to be a diffuse band in the photoabsorption study by Eidelsberg & Rostas (1990) and the C(3P) ion yield spectra by Okazaki et al. (2001). In the current study, the C+ ion photofragment spectra of the (5dσ) 1Σ+(v′ = 0) state for 13C16O and 12C18O are collected and shown in Fig. 3. Two broad diffuse peaks designated P branch and R branch can be observed for both 13C16O and 12C18O. The photodissociation branching ratios at these two diffuse peak positions are measured and listed in Tables 1 and 2 for 13C16O and 12C18O, respectively. Similar to the previous branching ratio measurements of 12C16O (Gao et al. 2012), only trace amounts of atomic photodissociation products are formed in the excited states for both 13C16O and 12C18O. This indicates that coupling with the D′ 1Σ+ state should play a major role in the predissociation process of the (5dσ) 1Σ+(v′ = 0) state. Slightly to the red side of the (5dσ) 1Σ+(v′ = 0) state of 13C16O, a highly rotationally resolved 1Σ+ band can be observed in Fig. 3, which does not appear in the C+ ion photofragment spectrum of 12C18O. This makes it hard to assign this band to 13C16O by considering the great spectral similarities between 13C16O and 12C18O. Further evidence comes from the fact that its relative intensity compared with that of the nearby (5dσ) 1Σ+(v′ = 0) state dramatically changes if 13C16O samples from different gas suppliers are used. This implies that the new band might be due to certain impurities contained in the samples. We collect TSVMI images of this band which appear almost the same as that of the (5dσ) 1Σ+(v′ = 0) state of 13C16O and 12C18O, while the TKERs only match with the photodissociation of CO if the photofragment combination of 13C and 18O is used. This leads us to tentatively assign this band to the (5dσ) 1Σ+(v′ = 0) state of 13C18O, which to the best of our knowledge has not been observed before. In the photoabsorption studies by Eidelsberg & Rostas (1990), Eidelsberg et al. (1991, 1992), the properties of the (5dσ) 1Σ+(v′ = 0) state of 13C18O were predicted through isotopic extrapolation based on the observations for 12C16O, 13C16O, and 12C18O. The band origin and rotational constant are determined to be 108 307.2 cm−1 and 1.812 cm−1, respectively, using PGOPHER simulation as listed in Table 3. The branching ratios into the two spin-forbidden channels C(1D) + O(3P) and C(3P) + O(1D) are both <1%, similar to 12C16O, 13C16O, and 12C18O; and no rotational dependence can be seen. This is consistent with the judgment that the (5dσ) 1Σ+(v′ = 0) state predissociates mainly through interaction with the valence D′ 1Σ+ state.
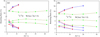 |
Fig. 8. Dependence of the photodissociation branching ratio on J′(J′+1) for the W(3sσ) 1Π(v′ = 3) state of (a) 13C16O and (b) 12C18O, respectively, where J′ is the rotational quantum number of the upper level. The error bars represent the standard deviations (1σ) of three independent measurements. Square: C(3P) + O(3P). Dot: C(1D) + O(3P). Triangle: C(3P) + O(1D). Blue: R-branch. Red: P-branch. Green: Q-branch. |
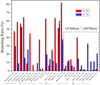 |
Fig. 9. Comparison of the percentages into the dissociation channel C(1D) + O(3P) for 27 absorption bands in the VUV region from 102 807 cm−1 (97.27 nm) to 109 700 cm−1 (91.16 nm) between 12C16O and 13C16O. The branching ratios of 12C18O are not presented because they are similar to those of 13C16O. The error bars represent the standard deviations (1σ) of three independent measurements. Red: 13C16O. Blue: 12C16O. The dotted box indicates the energy range investigated in the current study. The X-axis shows –1– branching ratios from Gao et al. (2013), Chi et al. (2020b); –2– branching ratios from Shi et al. (2018), Jiang et al. (2019a,b, 2020); and –3– branching ratios from Gao et al. (2011, 2012), Chi et al. (2020a) current study. |
3.8. W(3sσ) 1Π(v′ = 3) (Figs. 4, 8)
Recent high-resolution spectroscopic studies of the W(3sσ) 1Π(v′ = 3) state for 12C16O, 13C16O, and 12C18O by Eidelsberg et al. (2012, 2014) show that the predissociation rates are dependent on both rotation and parity. In the recent study of 12C16O by Gao et al. (2011), no obvious dependence of the photodissociation branching ratio on either rotation or the e/f parity was noted, probably because only branching ratios of J′ < 4 levels were measured. In the current study, the C+ ion photofragment spectra of the W(3sσ) 1Π(v′ = 3) state for 13C16O and 12C18O are collected and shown in Fig. 4. The photodissociation branching ratios measured in this study are listed in Tables 1 and 2, and plotted versus J′(J′+1) in Figs. 8a and b for 13C16O and 12C18O, respectively. The dissociation properties of 13C16O and 12C18O are very similar to each other, even though the relative values of branching ratios are slightly different. For e-parity levels (R- and P-branch), the percentages into the two spin forbidden channels decrease as J′ increases; while for f-parity levels (Q-branch), the percentages into the two spin forbidden channels are almost constant at low J′ levels. This observation is similar to that of W(3sσ) 1Π(v′ = 0) state as studied previously for 12C16O (Gao et al. 2013) and 13C16O (Chi et al. 2020b). Thus, interactions with repulsive states of both 1Π and 1Σ+ symmetries must have been involved in the predissociation process of the W(3sσ) 1Π(v′ = 3) state, where the 1Π state is responsible for the rotation and parity independent part, and the 1Σ+ state is responsible for the linear dependence of the branching ratio on J′(J′+1) for the e-parity levels. This is also consistent with recent high-resolution spectroscopic studies (Eidelsberg et al. 2012, 2014) showing that the predissociation rates of the e-parity levels increase linearly as a function of J′(J′+1), while those of the f-parity levels are almost independent of J′(J′+1). Despite the relatively large spectral shift (∼170 cm−1) due to the substitutions of 12C by 13C and 16O by 18O, the photodissociation branching ratios of 12C16O, 13C16O, and 12C18O for this state are all close to each other within the experimental uncertainties.
So far, the photodissociation branching ratios of the vast majority of strong absorption bands of 12C16O and 13C16O in the VUV region from 102 807 cm−1 (97.27 nm) to 109 700 cm−1 (91.16 nm) that are of astrophysical interest, as listed in Table 1 by Visser et al. (2009), have been measured and documented (Gao et al. 2011, 2012, 2013; Shi et al. 2018; Jiang et al. 2019a,b, 2020; Chi et al. 2020b,a). Extension of the measurements for 12C18O in the lower energy region from 102 807 cm−1 (97.27 nm) to 107 816 cm−1 (92.75 nm) is in progress. Due to the potential applications in modeling the C isotope distributions in the Solar System, we present an overall comparison in Fig. 9, where the percentages of dissociation into the channel C(1D) + O(3P) for all the measured absorption bands of 12C16O and 13C16O so far are put together as histograms. It is worth noting that the branching ratios of 13C16O and 12C18O are close to each other due to their similar reduced masses, and so the branching ratios of 12C18O are not presented in the histograms. For absorption bands whose branching ratios are rotation and parity dependent, the highest values measured within those bands are adopted in Fig. 9; and those bands for which both 12C16O and 13C16O predominantly dissociate into the ground channel C(3P) + O(3P) are not included in Fig. 9, such as for example (4sσ) 1Σ+(v′ = 1), (4pσ) 1Σ+(v′ = 1), and (5dσ) 1Σ+(v′ = 0). As shown in Fig. 9, for most of the absorption bands from 102 807 cm−1 to 109 200 cm−1, percentages into the channel of generating the excited C(1D) atoms for 13C16O are higher than or comparable to those for 12C16O, with the W(3sσ) 1Π(v′ = 1, 3), (4dσ) 1Σ+(v′ = 0), (6pσ) 1Σ+(v′ = 0), and I 1Π bands being the few exceptions. In the narrow energy window of 109 200–109 650 cm−1, a completely reversed scenario is observed, where 12C16O produces a comparable amount of ground and excited C atoms, while 13C16O almost completely dissociates into the ground channel. This indicates very different predissociation dynamics between 12C16O and 13C16O in this narrow energy region as tentatively described in the above section. This global comparison of the branching ratios into the spin-forbidden channel between different CO isotopologs should be extremely useful in mapping out the detailed Rydberg–Rydberg, Rydberg–valence interactions, which are important for understanding the predissociation dynamics of CO, and should benchmark any future theoretical calculations. Whether or not the strong isotope effect of the photodissociation branching ratio as observed here can affect the C isotope fractionation process that happened in the Solar System is still awaiting quantitative photochemical modeling, which should include the CO self-shielding effect and also the shielding effect from the H/H2 absorption (Shi et al. 2017; Lyons et al. 2018).
4. Summary
In this study, we collect the C+ ion photofragment spectra and measure the photodissociation branching ratios of 13C16O and 12C18O in the VUV photon energy region from 107 800 cm−1 (92.76 nm) to 109 700 cm−1 (91.16 nm). Several absorption bands of 12C16O in this energy region are reinvestigated up to higher J′ levels for comparisons with 13C16O and 12C18O. Strong isotope effects of the photodissociation branching ratios are observed for most of the absorption bands in the above-mentioned energy region due to the substitutions of 12C by 13C and 16O by 18O. On the other hand, the branching ratios of 13C16O and 12C18O are close to each other, which is to be expected due to their similar reduced masses. Even though a substantial number of spectroscopic studies have investigated the various CO isotopologs in this high-energy region (Casey 1978; Eidelsberg & Rostas 1990; Eidelsberg et al. 1991; Eikema et al. 1994; Huber 1997), analyses of the detailed predissociation dynamics in this region are still scarce; in particular, accurate potential energy curves are not available (Lefebvre-Brion & Kalemos 2016). The photodissociation branching ratio measurements for different CO isotopologs as presented in the current study can provide important information for unraveling the complicated predissociation dynamics of CO in this highly excited region.
Acknowledgments
This work is supported by the National Natural Science Foundation of China (Grant No.21803072), the Program for Young Outstanding Scientists of Institute of Chemistry, Chinese Academy of Science (ICCAS), and Beijing National Laboratory for Molecular Sciences (BNLMS). We thank Prof. Yang Pan (National Synchrotron Radiation Laboratory, University of Science and Technology of China) for instrumentation supports.
References
- Bally, J., & Langer, W. D. 1982, ApJ, 255, 143 [NASA ADS] [CrossRef] [Google Scholar]
- Bertoldi, F., Cox, P., Neri, R., et al. 2003, A&A, 409, L47 [NASA ADS] [CrossRef] [EDP Sciences] [Google Scholar]
- Burke, P. G., & Taylor, K. T. 1979, J Phys. B, 12, 2971 [NASA ADS] [CrossRef] [Google Scholar]
- Cantu, A. M., Mazzoni, M., Pettini, M., & Tozzi, G. P. 1981, Phys. Rev. A, 23, 1223 [NASA ADS] [CrossRef] [Google Scholar]
- Casey, M. 1978 (University College Dublin) [Google Scholar]
- Chakraborty, S., Ahmed, M., Jackson, T. L., & Thiemens, M. H. 2008, Science, 321, 1328 [NASA ADS] [CrossRef] [Google Scholar]
- Chi, X., Jiang, P., Qi, W., et al. 2020a, Mol. Phys., 1 [CrossRef] [Google Scholar]
- Chi, X., Jiang, P., Qi, W., et al. 2020b, ApJ, 891, 16 [NASA ADS] [CrossRef] [Google Scholar]
- Clayton, R. N. 2002, Nature, 415, 860 [NASA ADS] [CrossRef] [Google Scholar]
- Clayton, R. N. 2011, Proc 74th Annual Meteoritical Society Meeting (London, UK), 46, https://www.lpi.usra.edu/meetings/metsoc2011/pdf/5010.pdf [Google Scholar]
- Eidelsberg, M., & Rostas, F. 1990, A&A, 235, 472 [NASA ADS] [Google Scholar]
- Eidelsberg, M., Benayoun, J. J., Viala, Y., & Rostas, F. 1991, A&AS, 90, 231 [NASA ADS] [CrossRef] [Google Scholar]
- Eidelsberg, M., Benayoun, J. J., Viala, Y., et al. 1992, A&A, 265, 839 [NASA ADS] [Google Scholar]
- Eidelsberg, M., Launay, F., Ito, K., et al. 2004, J. Chem. Phys., 121, 292 [NASA ADS] [CrossRef] [Google Scholar]
- Eidelsberg, M., Sheffer, Y., Federman, S. R., et al. 2006, ApJ, 647, 1543 [NASA ADS] [CrossRef] [Google Scholar]
- Eidelsberg, M., Lemaire, J. L., Federman, S. R., et al. 2012, A&A, 543, A69 [NASA ADS] [CrossRef] [EDP Sciences] [Google Scholar]
- Eidelsberg, M., Lemaire, J. L., Federman, S. R., et al. 2014, A&A, 566, A96 [NASA ADS] [CrossRef] [EDP Sciences] [Google Scholar]
- Eidelsberg, M., Lemaire, J. L., Federman, S. R., et al. 2017, A&A, 602, A76 [NASA ADS] [CrossRef] [EDP Sciences] [Google Scholar]
- Eikema, K. S. E., Hogervorst, W., & Ubachs, W. 1994, Chem. Phys., 181, 217 [NASA ADS] [CrossRef] [Google Scholar]
- Federman, S. R., & Young, E. D. 2009, Science, 324, 1516 [NASA ADS] [CrossRef] [Google Scholar]
- Gao, H., Song, Y., Yang, L., et al. 2011, J. Chem. Phys., 135, 221101 [NASA ADS] [CrossRef] [PubMed] [Google Scholar]
- Gao, H., Song, Y., Yang, L., et al. 2012, J. Chem. Phys., 137, 034305 [NASA ADS] [CrossRef] [Google Scholar]
- Gao, H., Song, Y., Chang, Y. C., et al. 2013, J. Phys. Chem. A, 117, 6185 [CrossRef] [Google Scholar]
- Gao, H., Song, Y., Jackson, W. M., & Ng, C.-Y. 2020, Chin. J. Chem. Phys., 33, 91 [CrossRef] [Google Scholar]
- Gavilan, L., Lemaire, J. L., Eidelsberg, M., et al. 2013, J. Phys. Chem. A, 117, 9644 [CrossRef] [Google Scholar]
- Huber, K. P. 1997, MP&ES, 355, 1527 [Google Scholar]
- Jiang, P., Chi, X., Qi, W., et al. 2019a, PCCP, 21, 14376 [NASA ADS] [CrossRef] [Google Scholar]
- Jiang, P., Chi, X., Zhu, Q., et al. 2019b, Nat. Commun., 10, 3175 [NASA ADS] [CrossRef] [Google Scholar]
- Jiang, P., Chi, X., Zhu, Q., et al. 2020, PCCP, 22, 2549 [NASA ADS] [CrossRef] [Google Scholar]
- Komatsu, M., Ebata, T., Maeyama, T., & Mikami, N. 1995, JChPh, 103, 2420 [NASA ADS] [CrossRef] [Google Scholar]
- Lefebvre-Brion, H., & Kalemos, A. 2016, JChPh, 144, 134302 [NASA ADS] [Google Scholar]
- Lemaire, J. L., Heays, A. N., Eidelsberg, M., et al. 2018, A&A, 614, A114 [NASA ADS] [CrossRef] [EDP Sciences] [Google Scholar]
- Lyons, J. R., & Young, E. D. 2005, Nature, 435, 317 [NASA ADS] [CrossRef] [PubMed] [Google Scholar]
- Lyons, J. R., Lewis, R. S., & Clayton, R. N. 2009, Science, 324, 1516 [NASA ADS] [CrossRef] [Google Scholar]
- Lyons, J. R., Gharib-Nezhad, E., & Ayres, T. R. 2018, Nat. Commun., 9, 908 [NASA ADS] [CrossRef] [Google Scholar]
- Okazaki, A., Ebata, T., & Mikami, N. 2001, J. Chem. Phys., 114, 7886 [NASA ADS] [CrossRef] [Google Scholar]
- Qi, W., Jiang, P., Lin, D., et al. 2018, RvSI, 89, 013101 [Google Scholar]
- Rostas, F., Launay, F., Eidelsberg, M., et al. 1994, Can. J. Phys., 72, 913 [NASA ADS] [CrossRef] [Google Scholar]
- Shi, X., Yin, Q.-Z., Gao, H., et al. 2017, ApJ, 850, 48 [NASA ADS] [CrossRef] [Google Scholar]
- Shi, X., Gao, H., Yin, Q.-Z., et al. 2018, J. Phys. Chem. A, 122, 8136 [CrossRef] [Google Scholar]
- Stark, G., Heays, A. N., Lyons, J. R., et al. 2014, ApJ, 788, 67 [NASA ADS] [CrossRef] [Google Scholar]
- Ubachs, W., Eikema, K. S. E., Levelt, P. F., et al. 1994, ApJ, 427, L55 [NASA ADS] [CrossRef] [Google Scholar]
- van Dishoeck, E. F., & Black, J. H. 1988, ApJ, 334, 771 [NASA ADS] [CrossRef] [Google Scholar]
- Visser, R., van Dishoeck, E. F., & Black, J. H. 2009, A&A, 503, 323 [NASA ADS] [CrossRef] [EDP Sciences] [Google Scholar]
- Western, C. M. 2017, J. Quant. Spectr. Rad. Transf., 186, 221 [NASA ADS] [CrossRef] [Google Scholar]
- Yan, M., Dalgarno, A., Klemperer, W., & Miller, A. E. S. 2000, MNRAS, 313, L17 [NASA ADS] [CrossRef] [Google Scholar]
- Yin, Q.-Z., Shi, X., Chang, C., & Ng, C.-Y. 2009, Science, 324, 1516 [NASA ADS] [CrossRef] [Google Scholar]
- Yurimoto, H., & Kuramoto, K. 2004, Science, 305, 1763 [NASA ADS] [CrossRef] [PubMed] [Google Scholar]
Appendix A: Additional table
Photodissociation branching ratios of the channels C(3P) + O(1D), C(1D) + O(3P), and C(3P) + O(3P) for 12C16O in the region from 107 800 to 109 700 cm−1 (91.16–92.76 nm).
All Tables
Photodissociation branching ratios of the channels C(3P) + O(1D), C(1D) + O(3P), and C(3P) + O(3P) for 13C16O in the region from 107 800 to 109 700 cm−1 (91.16–92.76 nm).
Photodissociation branching ratios of the channels C(3P) + O(1D), C(1D) + O(3P), and C(3P) + O(3P) for 12C18O in the region from 107 800–109 700 cm−1 (91.16–92.76 nm).
Band origins and rotational constants for several vibronic states as determined in the present study by the PGOPHER program (Western 2017).
Photodissociation branching ratios into the channels C(3P) + O(1D), C(1D) + O(3P), and C(3P) + O(3P) for the 1Π(v′ = 2) state of 12C16O at 109 019.4 cm−1.
Photodissociation branching ratios of the channels C(3P) + O(1D), C(1D) + O(3P), and C(3P) + O(3P) for 12C16O in the region from 107 800 to 109 700 cm−1 (91.16–92.76 nm).
All Figures
|
Fig. 1. C+ ion photofragment spectra of 13C16O (top) and 12C18O (bottom) in the VUV photon energy region from 109 100 cm−1 to 109 700 cm−1, which include the following vibronic states: (6pσ) 1Σ+(v′ = 0), (6pπ) 1Π(v′ = 0), (4pσ) 1Σ+(v′ = 3), (4sσ) 1Σ+(v′ = 4), (5pπ) 1Π(v′ = 1), and (4pπ) 1Π(v′ = 3). The relative intensities of the spectra are not normalized according to the corresponding VUV intensities. Red arrows: (6pπ) 1Π(v′ = 0); blue arrows: (4pσ) 1Σ+(v′ = 3) and (4sσ) 1Σ+(v′ = 4). |
| In the text | |
|
Fig. 2. C+ ion photofragment spectra of 13C16O (top) and 12C18O (bottom) in the VUV photon energy region from 108 750 cm−1 to 108 942 cm−1, which include vibronic states: (6sσ) 1Σ+(v′ = 0), 1Π(v′ = 2) and an unknown underlying continuum as described in Sect. 3.3. The relative intensities of the spectra are not normalized according to the corresponding VUV intensities. Black: experimental spectra; red: simulated spectra by the PGOPHER program (Western 2017); blue arrows: broad underlying continuum. |
| In the text | |
|
Fig. 3. C+ ion photofragment spectra of 13C16O (top) and 12C18O (bottom) in the VUV photon energy region from 108 270 cm−1 to 108 510 cm−1, which include vibronic states: (5dσ) 1Σ+(v′ = 0), C′1Σ+(v′ = 9), a newly observed 1Π state of 13C16O and 12C18O, and the (5dσ) 1Σ+(v′ = 0) state of 13C18O (see Sect. 3.7 for detail). The relative intensities of the spectra are not normalized according to the corresponding VUV intensities. Black: Experimental spectra. Red: simulated spectra by the PGOPHER program (Western 2017). |
| In the text | |
|
Fig. 4. C+ ion photofragment spectra of the W(3sσ) 1Π(v′ = 3) state for 13C16O (top) and 12C18O (bottom). The relative intensities of the spectra are not normalized according to the corresponding VUV intensities. |
| In the text | |
|
Fig. 5. Comparison of TSVMI images and the corresponding TKER spectra among 12C16O, 13C16O and 12C18O for two absorption bands: R(0) line of the C′1Σ+(v′ = 9) state ((a), (b), (e), (f), (i), (j)) and R(0) line of the 1Π(v′ = 2) state ((c), (d), (g), (h), (k), (l)). The heights of the three peaks in the TKER spectra are rescaled by setting the highest peak in each spectrum to 1. |
| In the text | |
|
Fig. 6. Dependence of the photodissociation branching ratio into the three lowest dissociation channels C(3P) + O(3P), C(1D) + O(3P), and C(3P) + O(1D) on J′(J′+1) for the (4sσ) 1Σ+(v′ = 4) state of 12C16O, where J′ is the rotational quantum number of the upper level. The error bars represent the standard deviations (1σ) of three independent measurements. Square: C(3P) + O(3P); dot: C(1D) + O(3P); triangle: C(3P) + O(1D). Blue: R-branch. Red: P-branch. |
| In the text | |
|
Fig. 7. C+ ion photofragment spectra of the 1Π(v′ = 2) state for 12C16O. The relative intensities of the spectra are not normalized according to the corresponding VUV intensities. Black: experimental spectrum obtained in the current study. Red: simulated spectrum by the PGOPHER program (Western 2017). Blue: experimental spectrum obtained by Gao et al. (2011). |
| In the text | |
|
Fig. 8. Dependence of the photodissociation branching ratio on J′(J′+1) for the W(3sσ) 1Π(v′ = 3) state of (a) 13C16O and (b) 12C18O, respectively, where J′ is the rotational quantum number of the upper level. The error bars represent the standard deviations (1σ) of three independent measurements. Square: C(3P) + O(3P). Dot: C(1D) + O(3P). Triangle: C(3P) + O(1D). Blue: R-branch. Red: P-branch. Green: Q-branch. |
| In the text | |
|
Fig. 9. Comparison of the percentages into the dissociation channel C(1D) + O(3P) for 27 absorption bands in the VUV region from 102 807 cm−1 (97.27 nm) to 109 700 cm−1 (91.16 nm) between 12C16O and 13C16O. The branching ratios of 12C18O are not presented because they are similar to those of 13C16O. The error bars represent the standard deviations (1σ) of three independent measurements. Red: 13C16O. Blue: 12C16O. The dotted box indicates the energy range investigated in the current study. The X-axis shows –1– branching ratios from Gao et al. (2013), Chi et al. (2020b); –2– branching ratios from Shi et al. (2018), Jiang et al. (2019a,b, 2020); and –3– branching ratios from Gao et al. (2011, 2012), Chi et al. (2020a) current study. |
| In the text | |
Current usage metrics show cumulative count of Article Views (full-text article views including HTML views, PDF and ePub downloads, according to the available data) and Abstracts Views on Vision4Press platform.
Data correspond to usage on the plateform after 2015. The current usage metrics is available 48-96 hours after online publication and is updated daily on week days.
Initial download of the metrics may take a while.