Fig. 8.
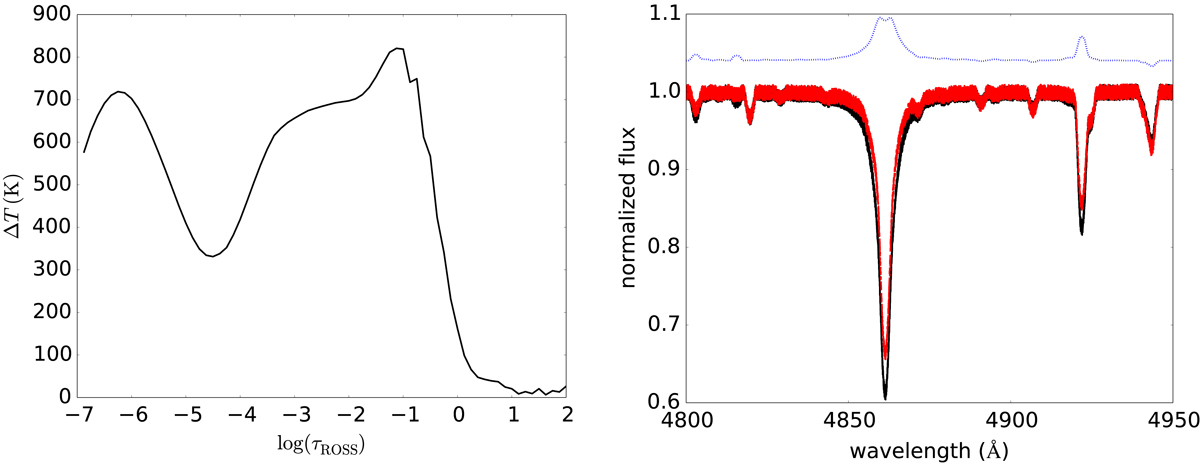
Left: temperature difference between a model atmosphere computed with a microturbulent velocity of ξ = 15 and 2 km s−1, as a function of the logarithm of the Rosseland optical depth. Right: differences in spectral line profiles associated with the change of microturbulent velocity in the model atmosphere from ξ = 2 km s−1 (solid black line) to ξ = 15 km s−1 (dashed red line). The difference spectrum (dotted blue line) was vertically shifted for clarity. Gaussian noise was added to both spectra to simulate a signal-to-noise ratio S/N ∼ 100.
Current usage metrics show cumulative count of Article Views (full-text article views including HTML views, PDF and ePub downloads, according to the available data) and Abstracts Views on Vision4Press platform.
Data correspond to usage on the plateform after 2015. The current usage metrics is available 48-96 hours after online publication and is updated daily on week days.
Initial download of the metrics may take a while.