Fig. 7.
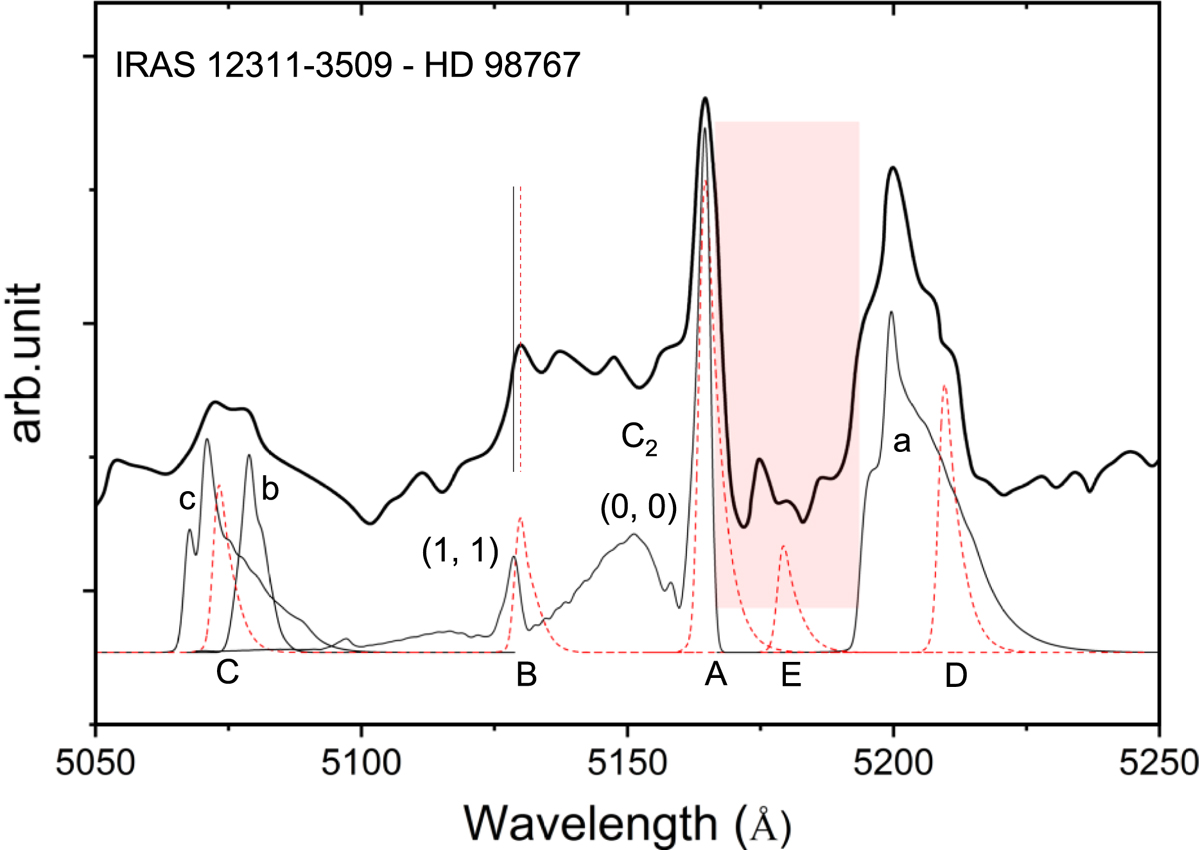
Comparison of the l-Si2C2A–E bands (red dashed curves) with the reduced optical spectrum of IRAS 12311−3509 (see Lloyd Evans et al. 2000). The simulated spectra of SiC2 and C2 bands (thin black curves) are also plotted, with the 2![]() , 2
, 2![]() , and 3
, and 3![]() bands of SiC2 (a, b, and c, respectively). A rotational temperature of ∼300 K is used in the spectral simulations of l-Si2C2, SiC2, and C2. The peak postions of the l-Si2C2 band B and the C2 (1, 1) Swan bandhead are indicated by vertical solid and dot lines, respectively.
bands of SiC2 (a, b, and c, respectively). A rotational temperature of ∼300 K is used in the spectral simulations of l-Si2C2, SiC2, and C2. The peak postions of the l-Si2C2 band B and the C2 (1, 1) Swan bandhead are indicated by vertical solid and dot lines, respectively.
Current usage metrics show cumulative count of Article Views (full-text article views including HTML views, PDF and ePub downloads, according to the available data) and Abstracts Views on Vision4Press platform.
Data correspond to usage on the plateform after 2015. The current usage metrics is available 48-96 hours after online publication and is updated daily on week days.
Initial download of the metrics may take a while.