Fig. 6.
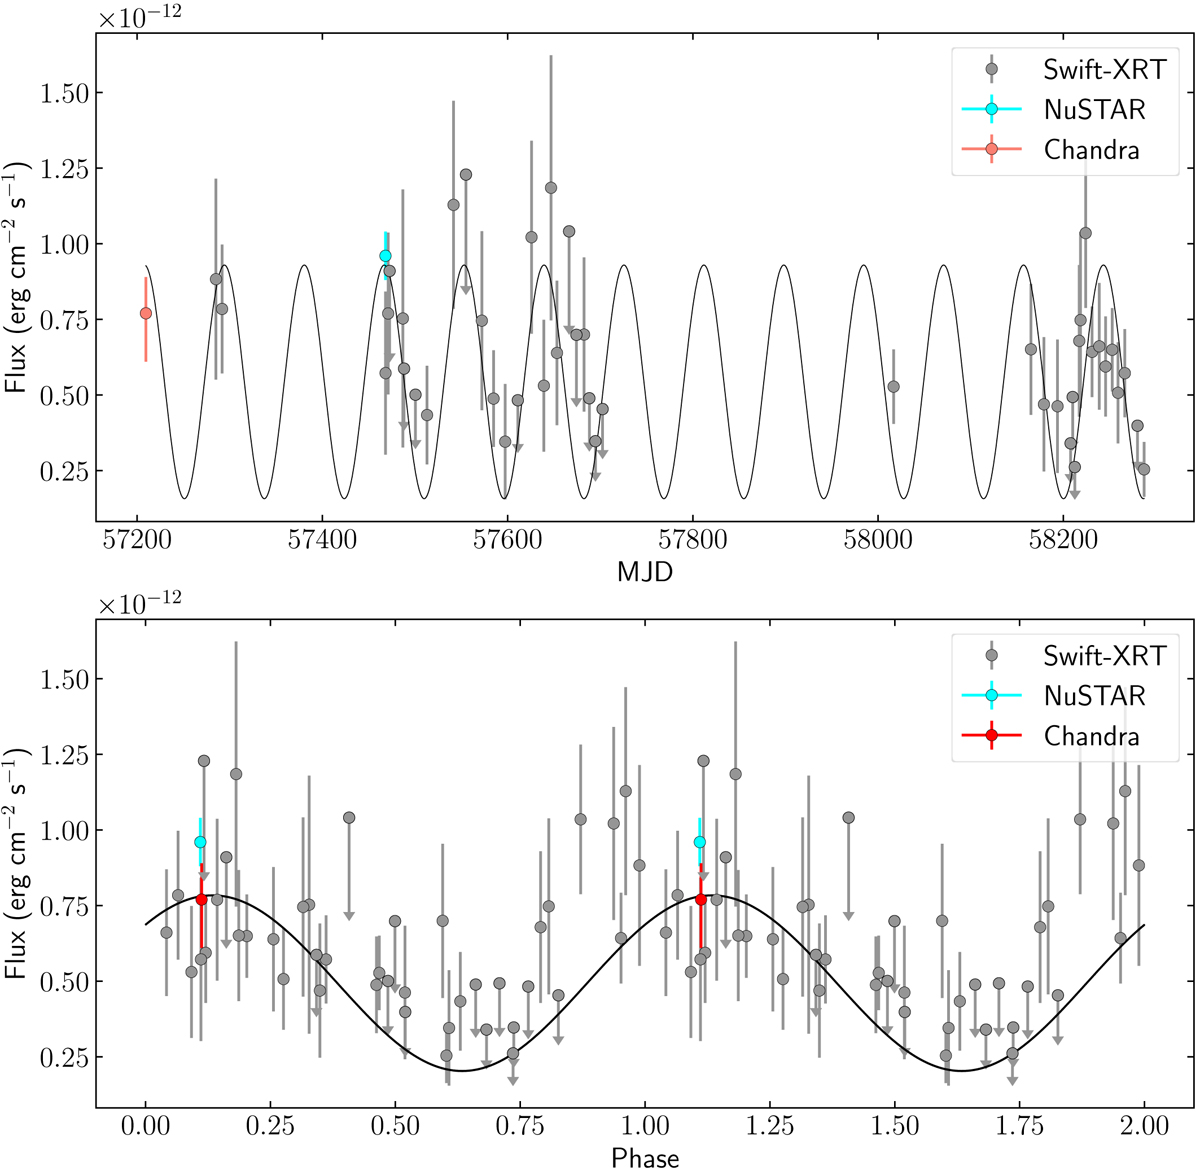
Top: X-ray light curve for XMMU J183245−0921539 in time space, including all observations performed after 57200 MJD. A sinusoidal function with fixed period to 86.28 days is fitted to the data. Bottom: phase-folded light curve of the same observations with that period. XMM re-analysis from Mori et al. (2017) has been added for completeness. Data are duplicated in two orbits for visualization purposes.
Current usage metrics show cumulative count of Article Views (full-text article views including HTML views, PDF and ePub downloads, according to the available data) and Abstracts Views on Vision4Press platform.
Data correspond to usage on the plateform after 2015. The current usage metrics is available 48-96 hours after online publication and is updated daily on week days.
Initial download of the metrics may take a while.