Free Access
Fig. 1.
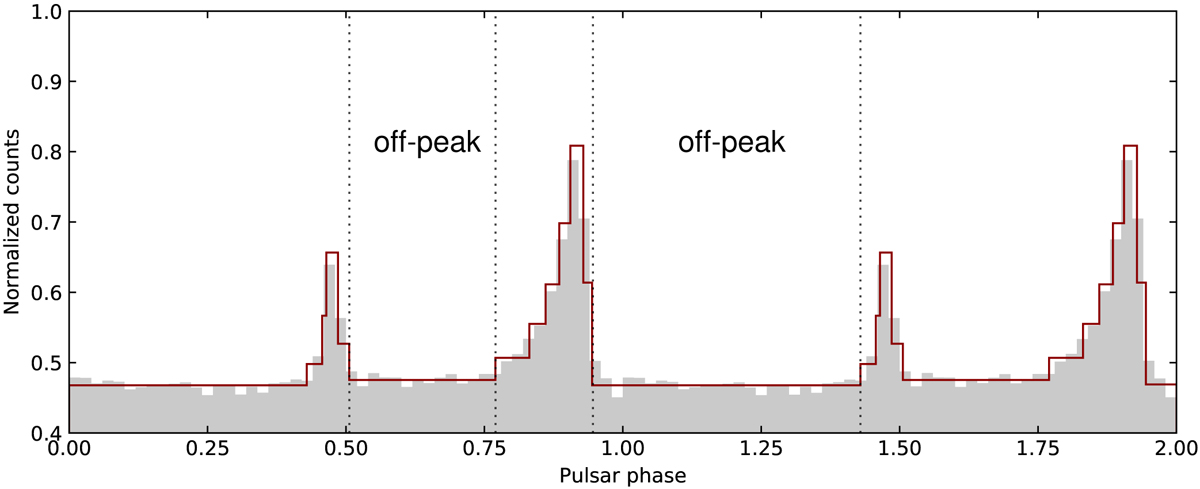
Pulse profile of PSR J1833−1034 with an ROI of 1° above 100 MeV binned with 100 bins per period (grey). Its Bayesian block representation is shown by the red profile. The off-peak phases are delimited by the vertical black lines.
Current usage metrics show cumulative count of Article Views (full-text article views including HTML views, PDF and ePub downloads, according to the available data) and Abstracts Views on Vision4Press platform.
Data correspond to usage on the plateform after 2015. The current usage metrics is available 48-96 hours after online publication and is updated daily on week days.
Initial download of the metrics may take a while.