Fig. 9.
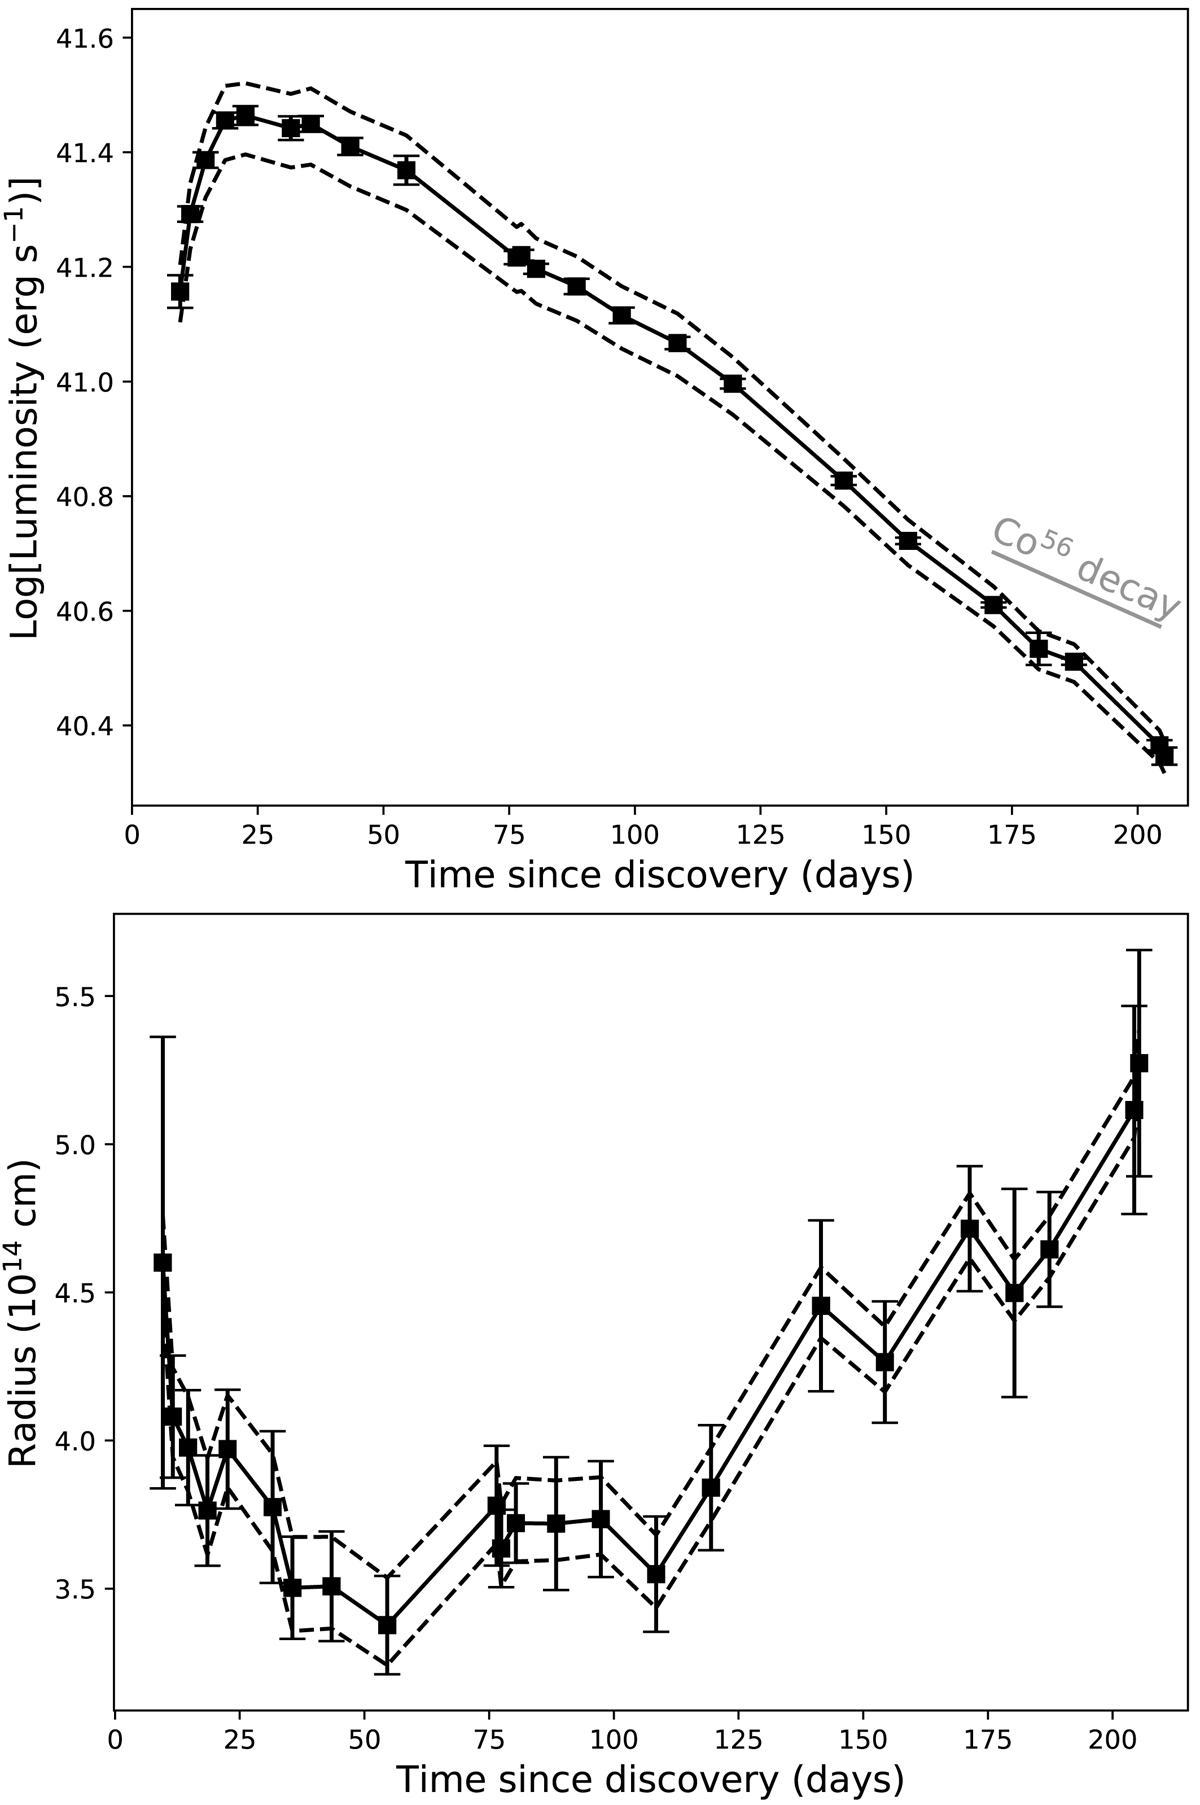
Top: luminosity evolution of AT 2019abn, derived from the blackbody fits to the photometry and integrated between 3000–23000 Å. The fading timescale expected if the light curve was powered by the radioactive decay of 56Co is also indicated for reference. Bottom: radius evolution of AT 2019abn, as derived from the luminosity and temperature fits, assuming luminosity, ![]() . The data points, which are joined by solid lines represent EB − V = 0.85, with the dashed lines representing EB − V = 0.9 and 0.79.
. The data points, which are joined by solid lines represent EB − V = 0.85, with the dashed lines representing EB − V = 0.9 and 0.79.
Current usage metrics show cumulative count of Article Views (full-text article views including HTML views, PDF and ePub downloads, according to the available data) and Abstracts Views on Vision4Press platform.
Data correspond to usage on the plateform after 2015. The current usage metrics is available 48-96 hours after online publication and is updated daily on week days.
Initial download of the metrics may take a while.