Fig. 8.
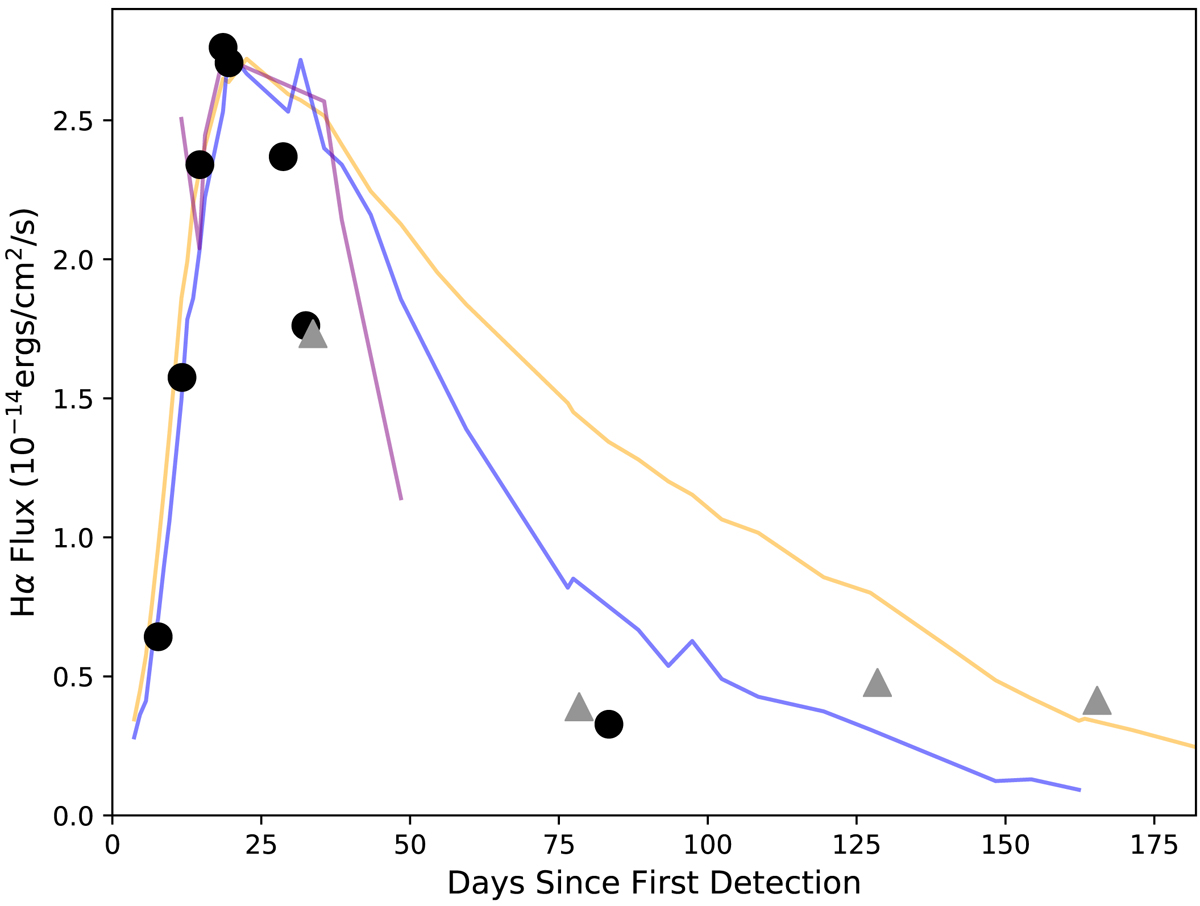
Evolution of Hα emission flux for AT 2019abn. Black circles show SPRAT measurements, with grey triangles showing OSIRIS measurements. The uncertainties on the calibration and measurements themselves will generally be relatively low. In some cases there may be significant uncertainties from the sky subtraction however, due to the complicated M51 background. The u′-band (purple), B-band (blue) and r-band (orange) optical light curves are also shown for reference (in relative flux, rather than magnitude, and not to any absolute scale).
Current usage metrics show cumulative count of Article Views (full-text article views including HTML views, PDF and ePub downloads, according to the available data) and Abstracts Views on Vision4Press platform.
Data correspond to usage on the plateform after 2015. The current usage metrics is available 48-96 hours after online publication and is updated daily on week days.
Initial download of the metrics may take a while.