Fig. 10.
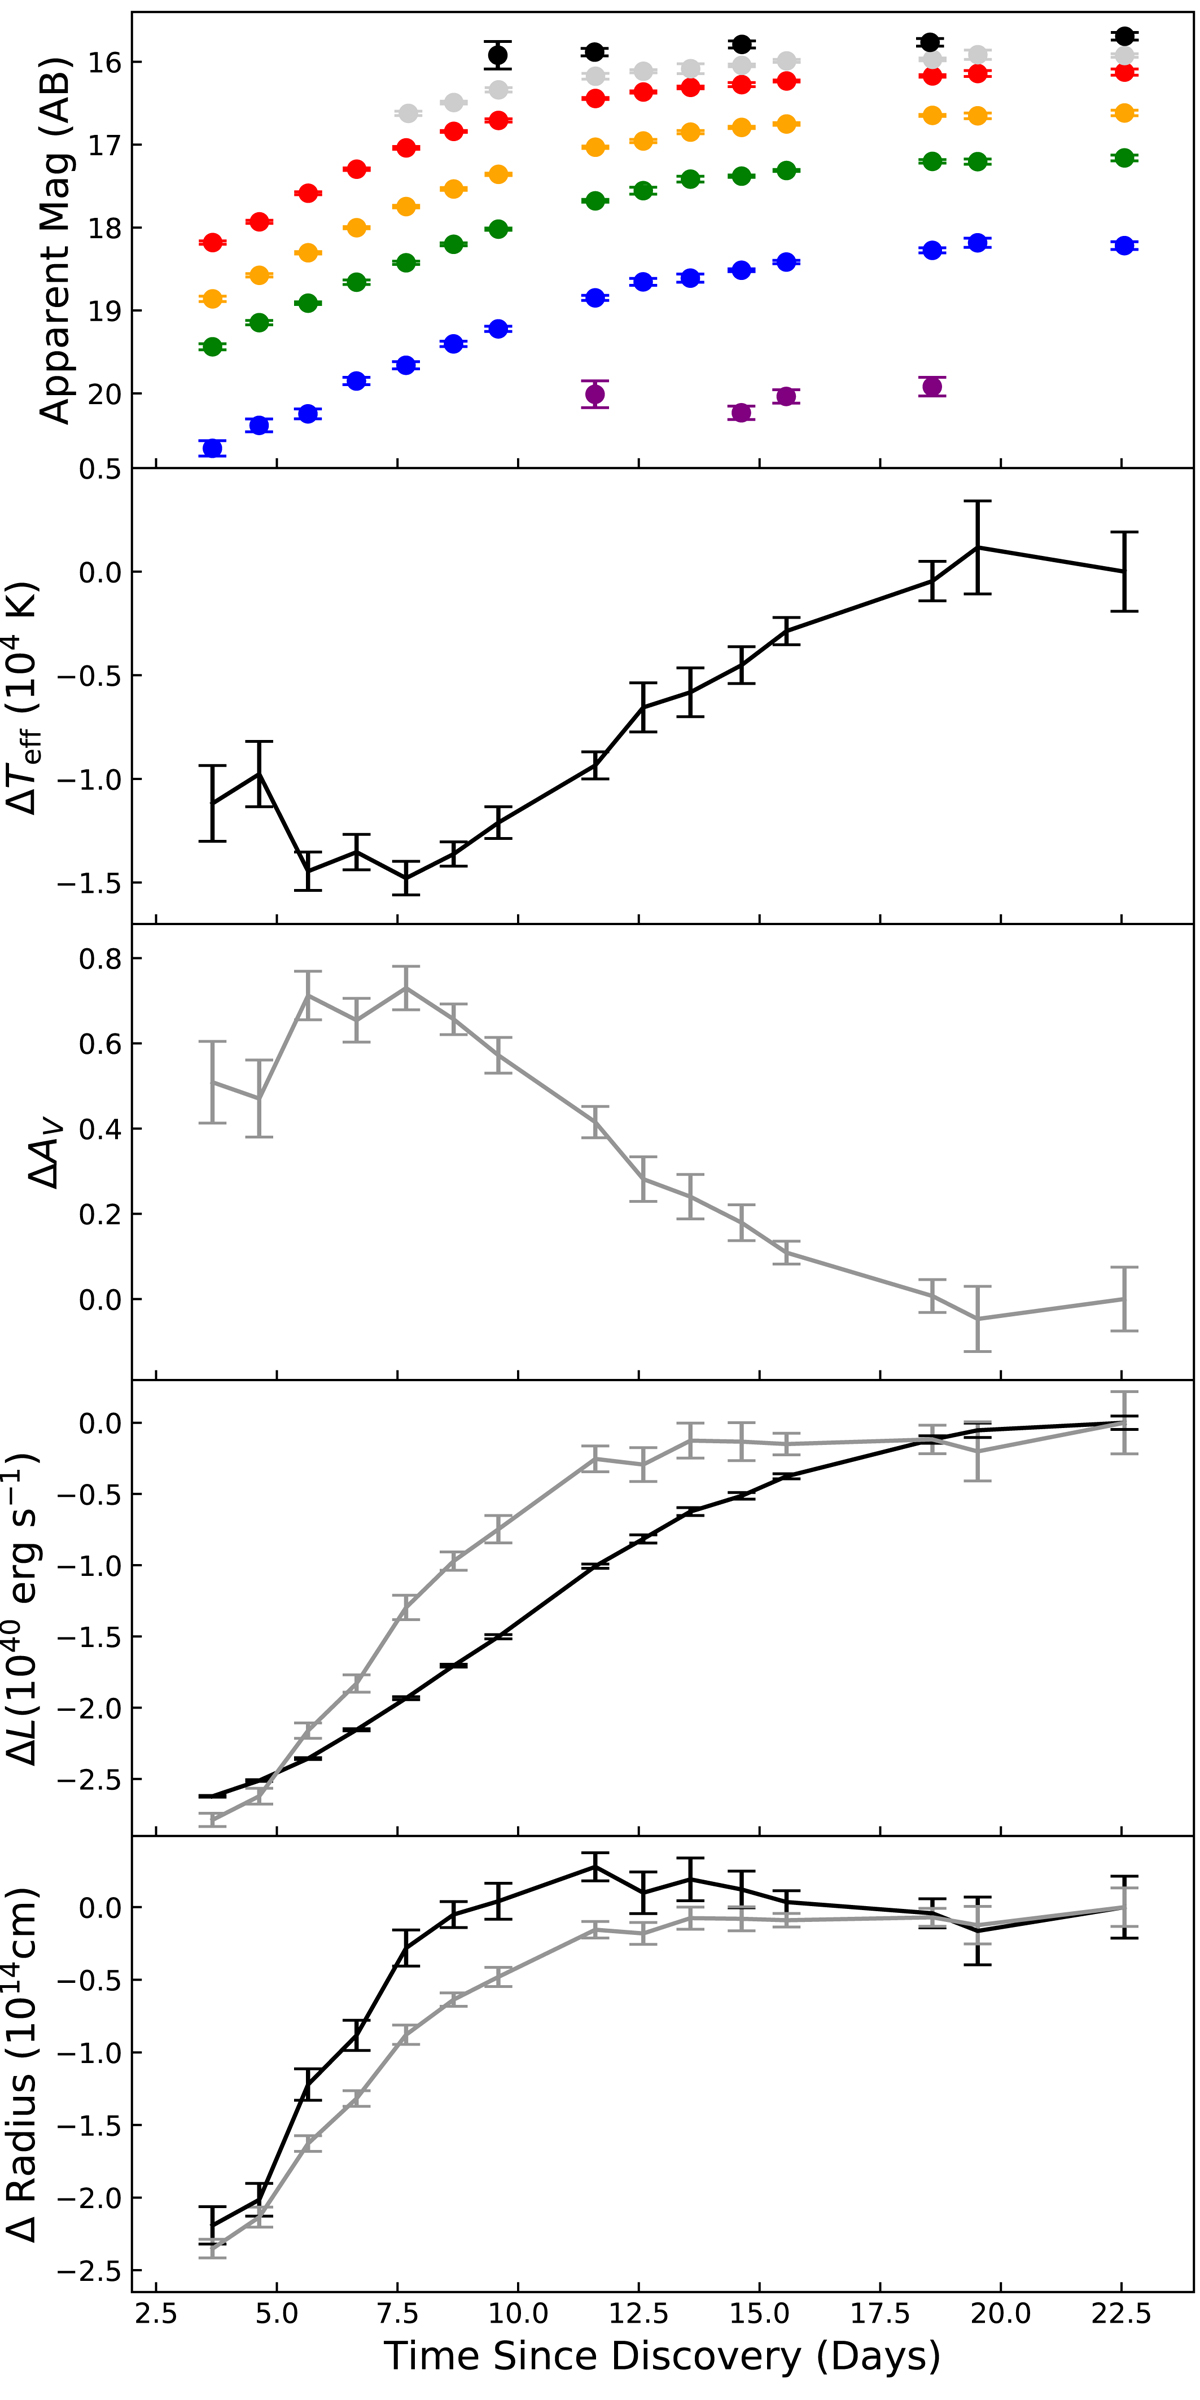
First panel (top): early light curve of AT 2019abn (key as in Fig. 1). Second panel: early temperature evolution of AT 2019abn, assuming no change in dust extinction. Third panel: implied additional dust extinction to that seen at peak, if one assumes a constant temperature of T = 7500 K over this portion of the light curve. Fourth panel: early luminosity evolution of AT 2019abn. Fifth panel (bottom): early radius evolution of AT 2019abn. In the last two panels, the black and grey points represent the different assumptions of constant extinction (EB − V = 0.85) and constant temperature (T = 7500 K), respectively.
Current usage metrics show cumulative count of Article Views (full-text article views including HTML views, PDF and ePub downloads, according to the available data) and Abstracts Views on Vision4Press platform.
Data correspond to usage on the plateform after 2015. The current usage metrics is available 48-96 hours after online publication and is updated daily on week days.
Initial download of the metrics may take a while.