Open Access
Fig. 6.
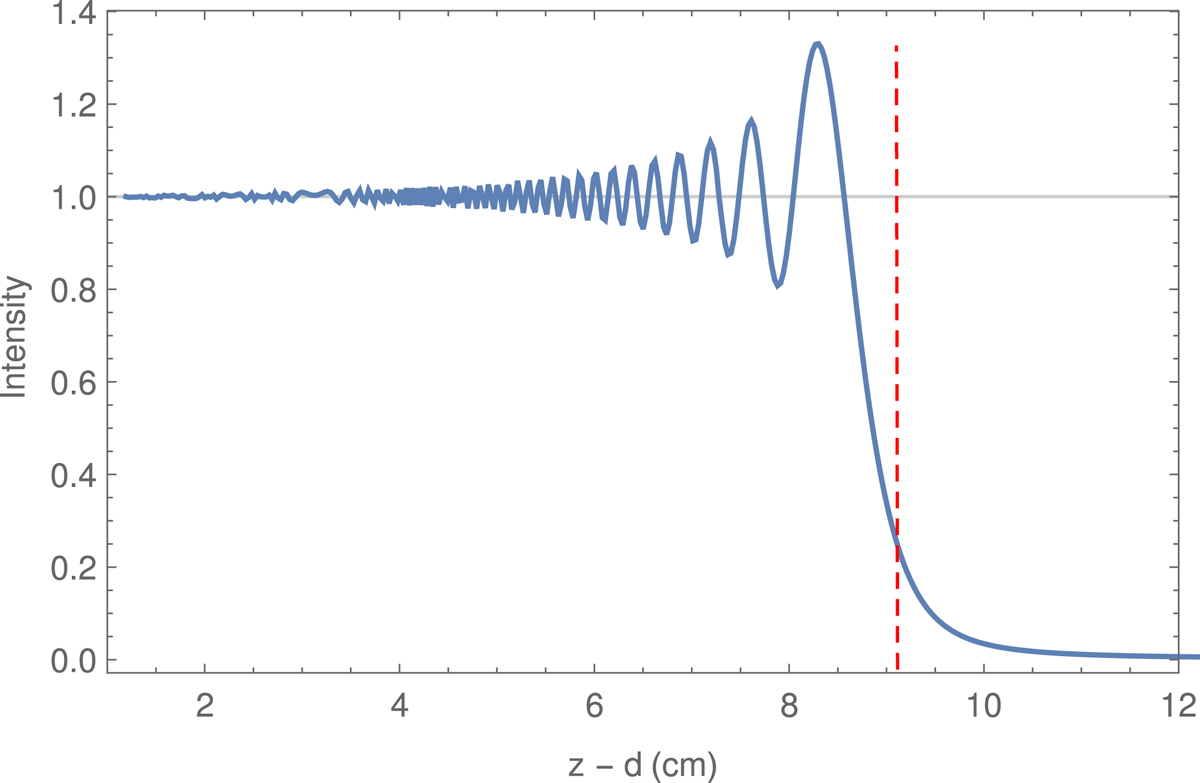
Intensity of the Arago spot observed at z = 1 m for a system of two disks of dimensions Ω = 4.4 cm and ω = 4 cm, as a function of the distance z − d between the first and second disk. The vertical red dashed line corresponds to the distance when the second disk enters the blue triangle of Fig. 1.
Current usage metrics show cumulative count of Article Views (full-text article views including HTML views, PDF and ePub downloads, according to the available data) and Abstracts Views on Vision4Press platform.
Data correspond to usage on the plateform after 2015. The current usage metrics is available 48-96 hours after online publication and is updated daily on week days.
Initial download of the metrics may take a while.