Fig. 4.
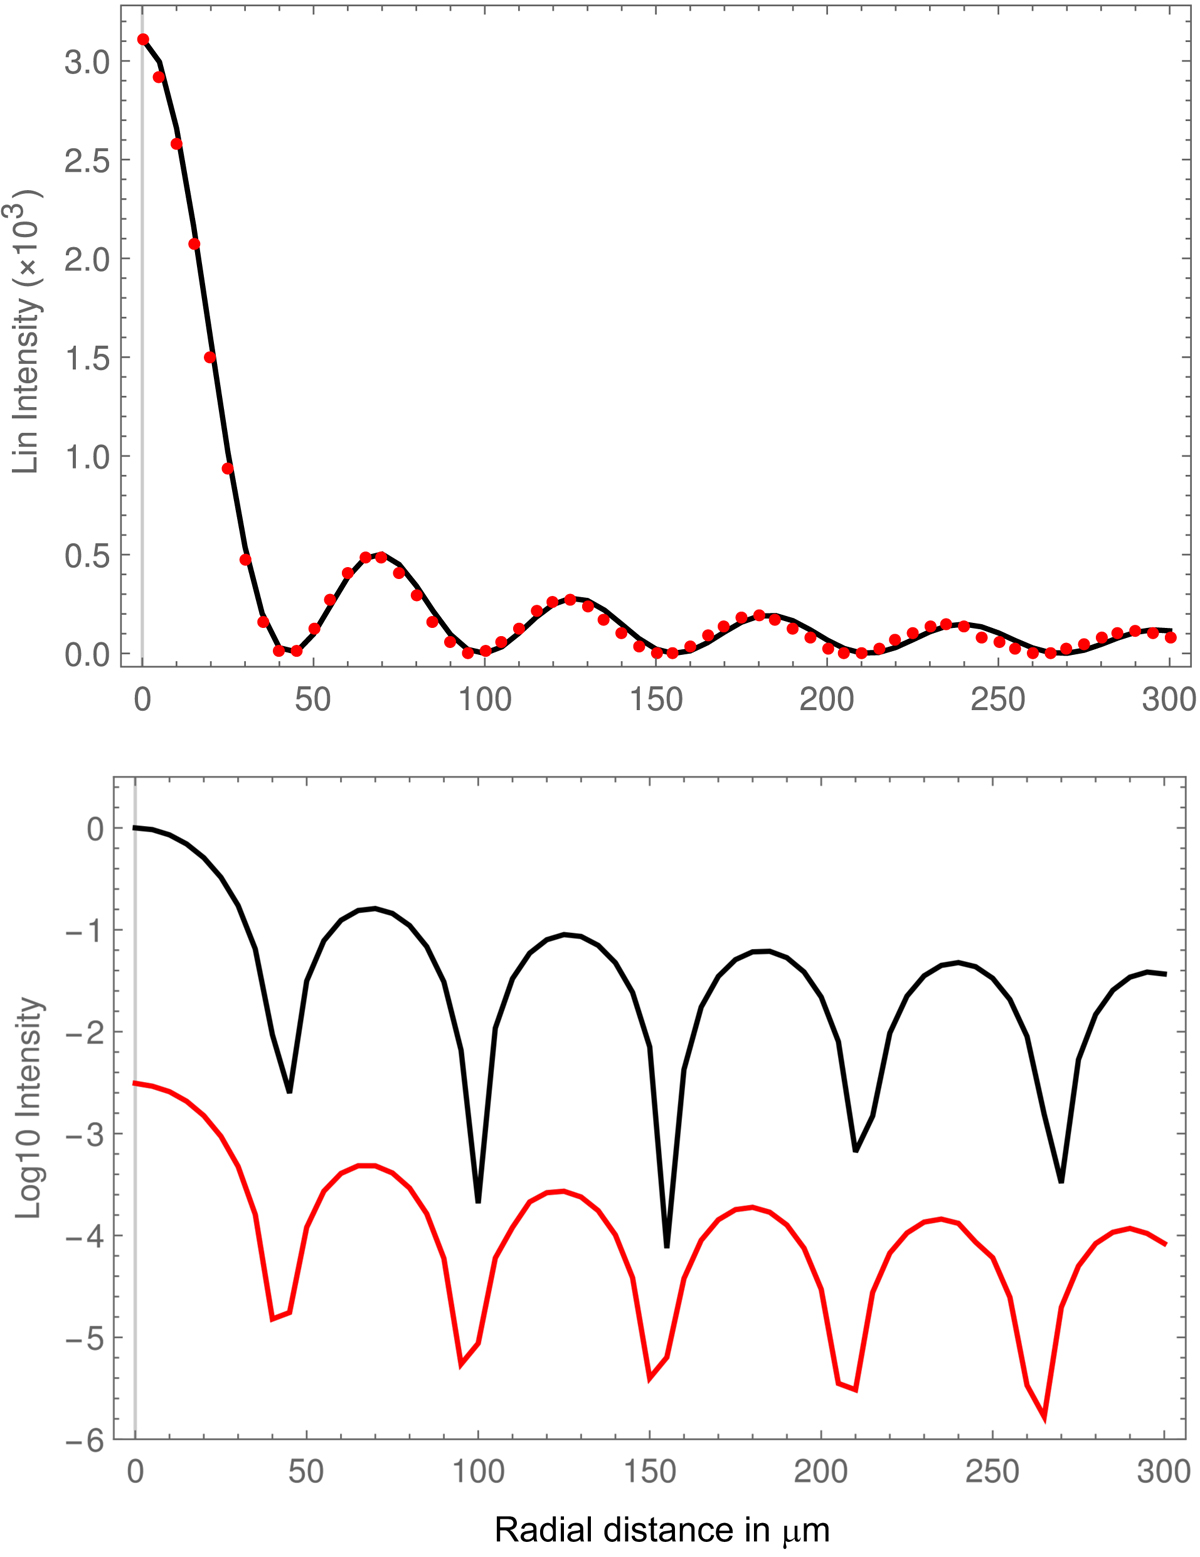
Fresnel diffraction with two disks for a central region close to the Arago spot, for Ω = 1.42 m, ω = 1.40524 m, z = 144.3 m, and z − d = 3 m. The top panel is in linear scale; the red dots correspond to Eq. (11) and the continuous curve to the Fresnel diffraction of the disk ω alone attenuated by a factor of 321. Bottom panel: two curves in log10 scales (black, disk Ω alone, red, the system of two disks).
Current usage metrics show cumulative count of Article Views (full-text article views including HTML views, PDF and ePub downloads, according to the available data) and Abstracts Views on Vision4Press platform.
Data correspond to usage on the plateform after 2015. The current usage metrics is available 48-96 hours after online publication and is updated daily on week days.
Initial download of the metrics may take a while.