Open Access
Fig. 10.
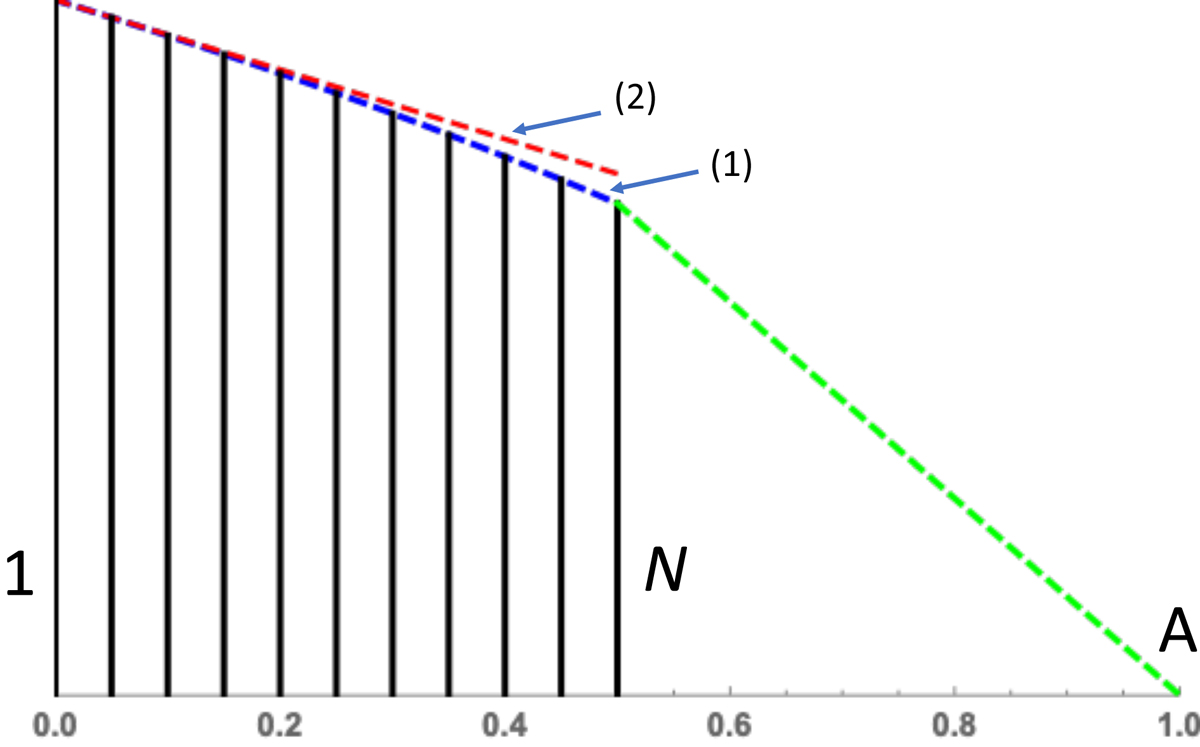
Illustration of the optimal envelope for the solution given in Eq. (17) and α = 1. The exact curve (1) and linear approximation (2) of Eq. (18) are shown as the blue and red dashed lines, respectively. The drawing is made for z0 = 1 m, and the multiple disks extending up to 0.5 m. These values are for illustration only.
Current usage metrics show cumulative count of Article Views (full-text article views including HTML views, PDF and ePub downloads, according to the available data) and Abstracts Views on Vision4Press platform.
Data correspond to usage on the plateform after 2015. The current usage metrics is available 48-96 hours after online publication and is updated daily on week days.
Initial download of the metrics may take a while.