Fig. A.1
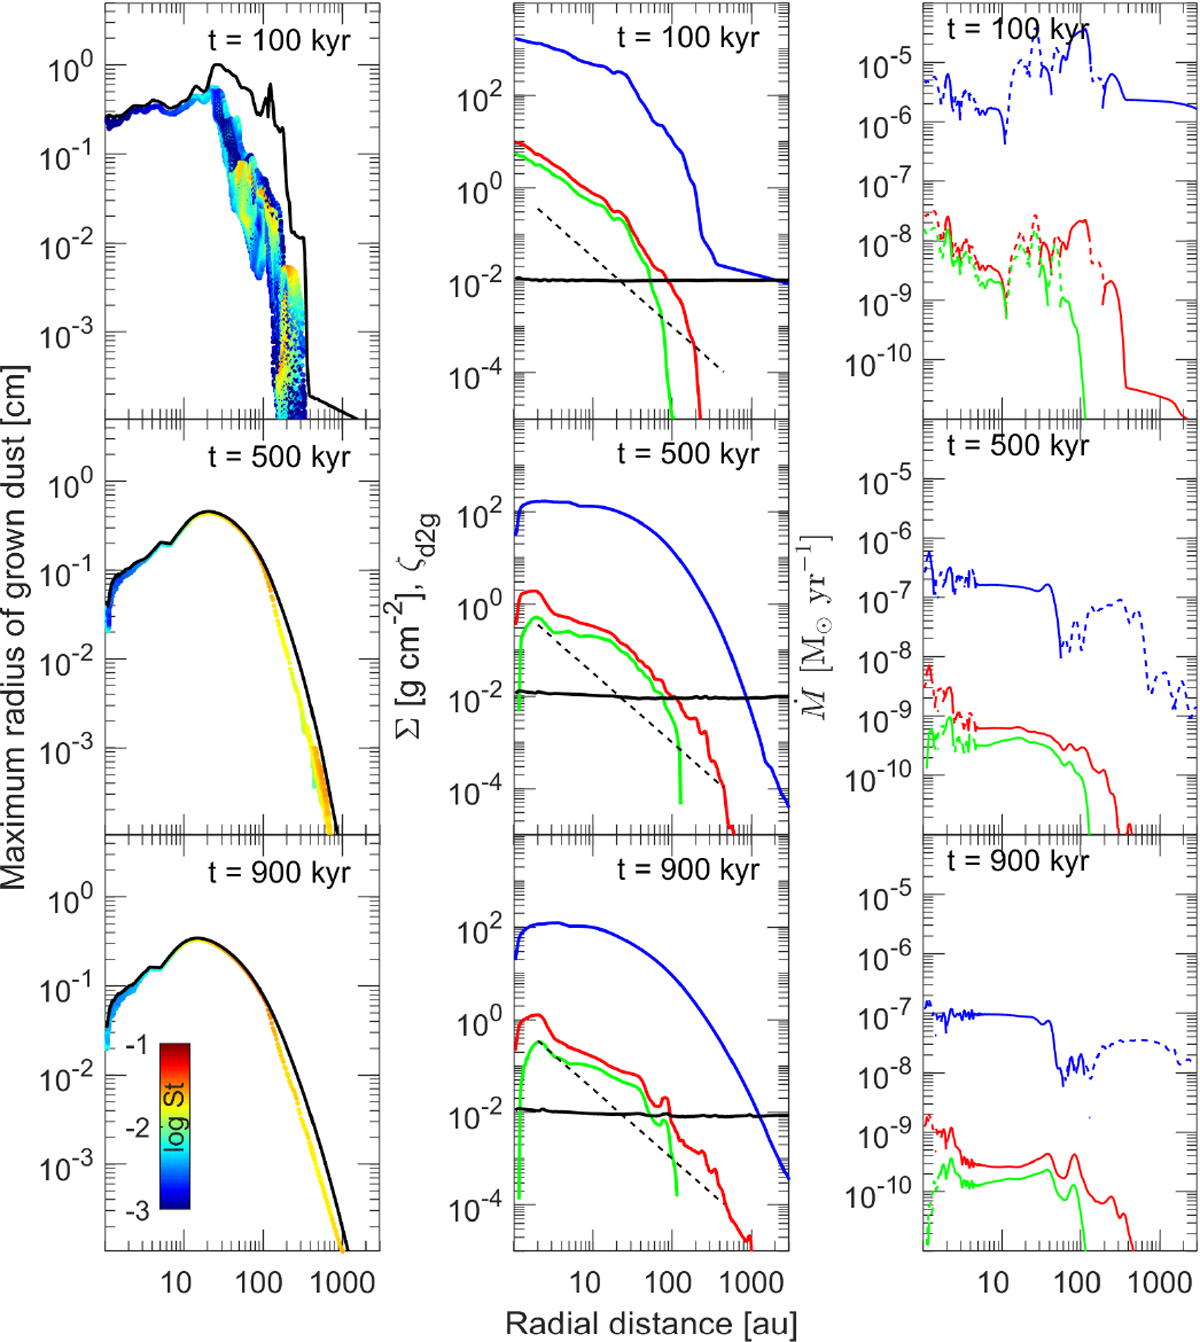
Left column: radial distribution of the maximum radius of grown dust for all azimuthal grid points in model L2. Color of dots shows the value of Stokes number for each azimuthal grid point. Solid black line shows the dust fragmentation size afrag. Middle column: azimuthally averaged dust-to-gas mass ratio (black), surface density of gas (blue curve), grown dust (red curve),and pebbles (green curve) vs. radial distance from the star. The dashed line shows the power-law slope ∝ r−1.5. Right column: azimuthally averaged absolute values of gas (blue curve), grown dust (red curve), and pebble (green curve) accretion (transport) rates vs. radial distance from the star. Dashed part of the curve shows the outward migration, solid part – the inward migration.
Current usage metrics show cumulative count of Article Views (full-text article views including HTML views, PDF and ePub downloads, according to the available data) and Abstracts Views on Vision4Press platform.
Data correspond to usage on the plateform after 2015. The current usage metrics is available 48-96 hours after online publication and is updated daily on week days.
Initial download of the metrics may take a while.