Fig. 4
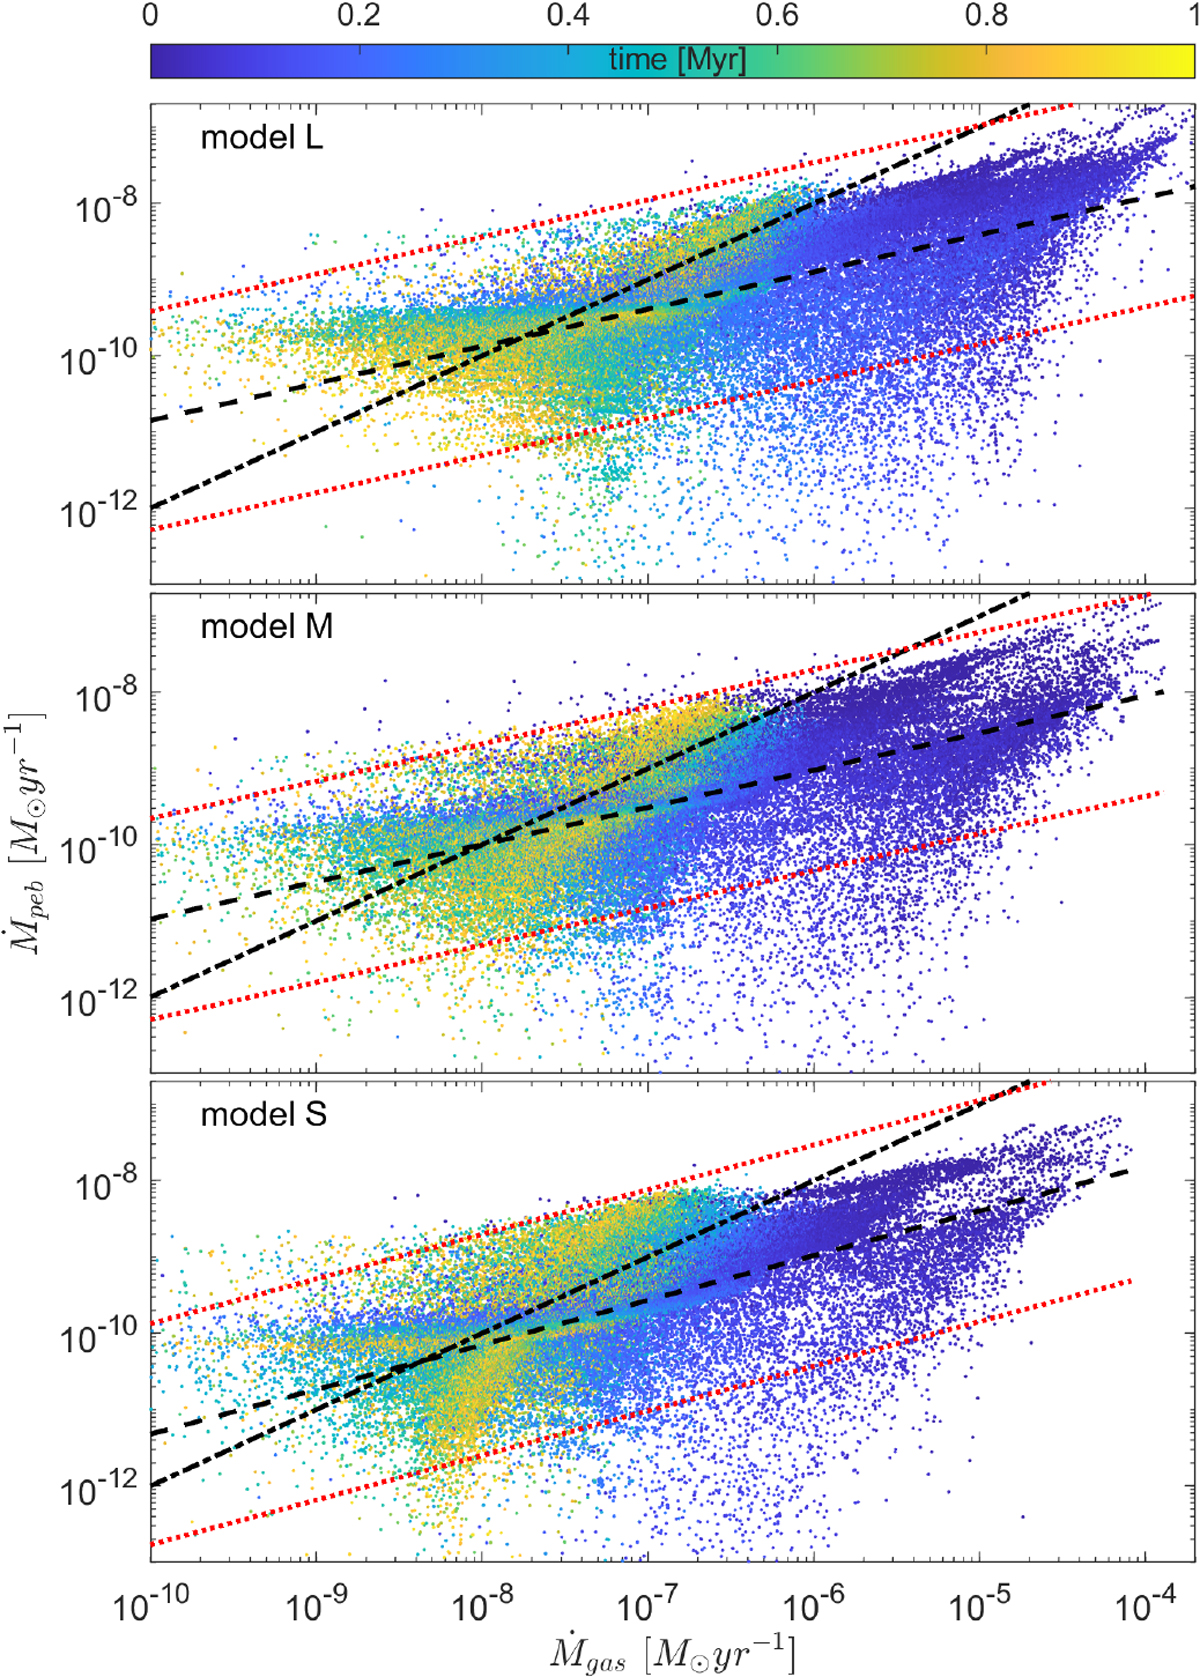
Relation between pebble mass flux Ṁpeb and gas mass flux Ṁgas for all our models. Color of the dots presents the age of the system in Myr. The black dashed line shows the best-fit curve for each model. The red dotted lines show the ± 3σ deviation from the best-fit values. The dash-dotted line shows the Ṁpeb = 0.01Ṁg dependence.
Current usage metrics show cumulative count of Article Views (full-text article views including HTML views, PDF and ePub downloads, according to the available data) and Abstracts Views on Vision4Press platform.
Data correspond to usage on the plateform after 2015. The current usage metrics is available 48-96 hours after online publication and is updated daily on week days.
Initial download of the metrics may take a while.