Fig. 7.
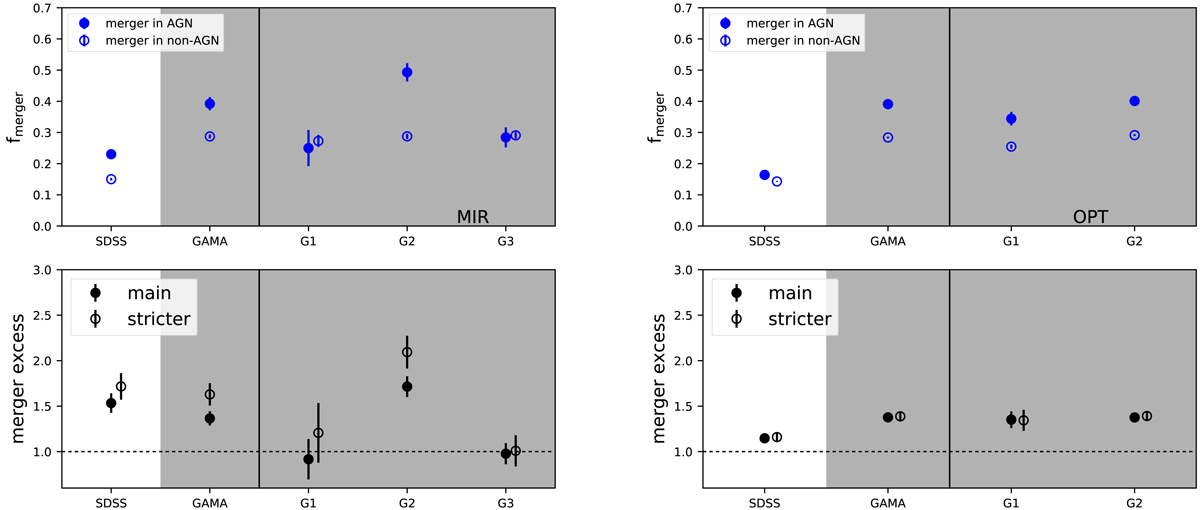
Left: merger fractions in MIR AGNs and non-AGNs for the SDSS and GAMA sample. We also divide the GAMA sample into three redshift bins. Right: merger fractions in OPT AGNs and non-AGNs for the SDSS and GAMA sample. We also divide the GAMA sample into two redshift bins. Errors are calculated through binomial statistics. Bottom panels: ratio of merger fraction in AGNs relative to that in non-AGNs (i.e., merger excess) for the main sample and a stricter merger identification threshold. The dashed lines indicate the excess value of one, which means no difference in the merger fraction in AGNs relative to non-AGNs. Again, we find a qualitatively consistent picture between the SDSS and GAMA samples in which the merger fraction is higher in AGNs compared to non-AGNs.
Current usage metrics show cumulative count of Article Views (full-text article views including HTML views, PDF and ePub downloads, according to the available data) and Abstracts Views on Vision4Press platform.
Data correspond to usage on the plateform after 2015. The current usage metrics is available 48-96 hours after online publication and is updated daily on week days.
Initial download of the metrics may take a while.